Introduction & Overview
What is Site Reliability Engineering (SRE)?
Site Reliability Engineering (SRE) is a discipline that incorporates software engineering principles into infrastructure and operations tasks, aiming to build scalable and highly reliable software systems. Introduced by Google, SRE bridges the gap between development and operations by applying software engineering approaches to system administration topics.

History or Background
- Coined at Google in the early 2000s by Ben Treynor Sloss.
- Inspired by the challenges of managing planet-scale infrastructure reliably.
- Over time, SRE practices have been adopted by major tech companies like Netflix, Facebook, and Amazon.
Why is SRE Relevant in DevSecOps?
DevSecOps emphasizes embedding security throughout the DevOps lifecycle. SRE complements this by ensuring that:
- Systems are reliable, available, and secure by default.
- Automation, monitoring, and resiliency are integrated into security-aware pipelines.
- It enables secure failover, observability, and incident response practices aligned with modern threat landscapes.
Core Concepts & Terminology
Key Terms and Definitions
| Term | Definition |
|---|---|
| SLI (Service Level Indicator) | A quantitative measure of system performance (e.g., uptime, latency). |
| SLO (Service Level Objective) | Target value or range for SLIs (e.g., 99.9% availability). |
| SLA (Service Level Agreement) | Formal agreement outlining expected performance and penalties. |
| Error Budget | Allowed threshold of errors within SLOs before action is taken. |
| Toil | Manual, repetitive operational work that SRE seeks to eliminate. |
| Blameless Postmortem | Analysis of failures to improve systems without assigning fault. |
How It Fits into the DevSecOps Lifecycle
| DevSecOps Phase | SRE Contributions |
|---|---|
| Plan | Define SLOs, SLIs; risk modeling |
| Develop | Integrate reliability and security testing |
| Build | Automate secure and repeatable builds |
| Test | Continuous monitoring and failure injection |
| Release | Safe deployments using canary or blue-green |
| Deploy | Observability, rollback automation |
| Operate | Incident response, root cause analysis |
| Monitor | Real-time metrics, alerting, dashboards |
Architecture & How It Works
Components of SRE
- Monitoring and Observability Tools
- Prometheus, Grafana, Datadog
- Incident Management Systems
- PagerDuty, Opsgenie, VictorOps
- Automation and CI/CD Integrations
- Jenkins, GitHub Actions, ArgoCD
- Chaos Engineering Platforms
- Gremlin, Chaos Monkey
- Configuration as Code
- Terraform, Ansible, Helm
Internal Workflow
[ Code → Build → Test → Deploy ] ↔ [ SRE Monitoring → Alerting → Incident Response → RCA → Improvement ]
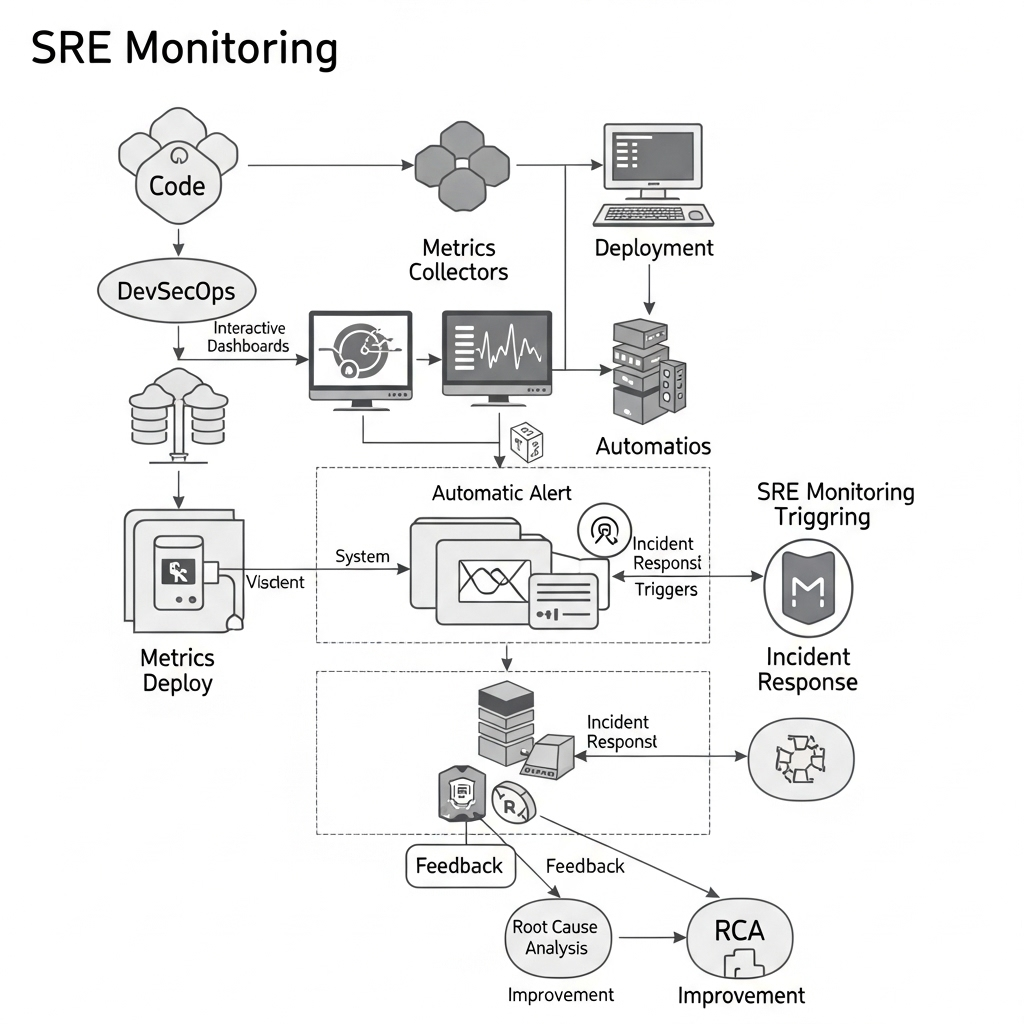
Architecture Diagram (Description)
A typical SRE setup involves:
- Metrics collectors (e.g., Prometheus) gathering system data.
- Visualization dashboards (Grafana) for monitoring.
- Alerting tools (e.g., Alertmanager) to notify engineers.
- Incident response tools (e.g., PagerDuty).
- Feedback loops integrating reliability fixes back into DevSecOps pipelines.
Integration Points with CI/CD or Cloud Tools
| CI/CD Tool | SRE Integration |
|---|---|
| Jenkins | Trigger SLO compliance checks before deploy |
| GitLab CI | Auto rollback on failed reliability tests |
| ArgoCD | SLO-aware GitOps with automated drift detection |
| AWS CloudWatch | Integrates with SLIs and alerting tools |
| Kubernetes | Pod health checks, auto-scaling, readiness probes |
Installation & Getting Started
Basic Setup or Prerequisites
- Containerized environment (Docker/Kubernetes)
- Monitoring Stack: Prometheus + Grafana
- Alerting System: Alertmanager, Slack, Email
- CI/CD Tool: Jenkins or GitHub Actions
- Access to cloud resources (e.g., AWS, GCP)
Hands-on: Step-by-Step Setup (Prometheus + Grafana on Kubernetes)
1. Install Prometheus using Helm:
helm repo add prometheus-community https://prometheus-community.github.io/helm-charts
helm install prometheus prometheus-community/kube-prometheus-stack
2. Access Prometheus & Grafana:
kubectl port-forward svc/prometheus-operated 9090
kubectl port-forward svc/grafana 3000
3. Create a Simple SLO:
apiVersion: monitoring.coreos.com/v1
kind: ServiceMonitor
metadata:
  name: web-slo
spec:
  endpoints:
  - port: web
    interval: 30s
4. Configure Alert in Prometheus:
groups:
- name: example
  rules:
  - alert: HighErrorRate
    expr: rate(http_requests_total{status="500"}[5m]) > 0.05
    for: 1m
    labels:
      severity: critical
    annotations:
      summary: "High 500 error rate detected"
Real-World Use Cases
1. Zero-Downtime Deployments in FinTech
- SRE ensures customer-facing APIs meet 99.99% uptime during deployments.
- Canary releases + automated rollback via GitLab CI.
2. Incident Management in E-Commerce
- Real-time monitoring of checkout systems using SLOs.
- PagerDuty integrated with Slack for immediate response.
3. Chaos Engineering for SaaS Applications
- Injecting faults using Chaos Monkey to validate resilience.
- Error budgets inform development speed.
4. Healthcare Compliance Monitoring
- HIPAA-regulated systems monitored for latency, security breaches.
- SLO dashboards reviewed during audits.
Benefits & Limitations
Key Advantages
- Higher reliability and availability
- Reduced operational overhead via automation
- Proactive issue detection with observability
- Cultural alignment with DevSecOps (blameless postmortems, feedback loops)
Common Challenges
- Toolchain complexity
- SLO/SLA definition disputes
- Cultural resistance to change
- Alert fatigue due to poor alerting configuration
Best Practices & Recommendations
Security Tips
- Monitor failed login attempts, token expiries, and unusual activity.
- Include SLOs for security-related SLIs (e.g., patch times, firewall latency).
Performance & Maintenance
- Regularly revisit SLOs as systems evolve.
- Reduce Toil via scripting and automation.
Compliance Alignment
- Log and audit incident responses for SOC 2, HIPAA, ISO compliance.
- Demonstrate proactive detection and resolution capabilities.
Automation Ideas
- Auto-scale based on latency SLIs.
- Trigger security scans or patches based on real-time metrics.
Comparison with Alternatives
| Feature | SRE | Traditional Ops | DevOps (w/o SRE) |
|---|---|---|---|
| Reliability Focus | ✅ Core mission | ⚠️ Varies | ⚠️ Often implicit |
| Automation & Toil Reduction | ✅ High priority | ⚠️ Manual-heavy | ✅ Moderate |
| Security Integration | ✅ Aligned with DevSecOps | ⚠️ Fragmented | ✅ With add-ons |
| Metrics-Driven Decision Making | ✅ Uses SLOs/SLIs/Error Budgets | ❌ Limited | ⚠️ Varies |
When to Choose SRE
- You need reliable, secure, and scalable systems.
- You’re running distributed microservices in production.
- You want to reduce human intervention in incident management.
Conclusion
Site Reliability Engineering (SRE) is a powerful complement to DevSecOps, infusing it with automation, observability, and operational rigor. By treating operations as a software problem, teams can build resilient systems that align with both business goals and security standards.
Future Trends
- AI-powered alerting and self-healing
- SRE-driven policy-as-code
- Tight compliance-SLO integrations
Next Steps
- Adopt SRE principles gradually—start with SLIs and postmortems.
- Invest in training and cross-team collaboration.
- Leverage open-source tools before investing in enterprise suites.