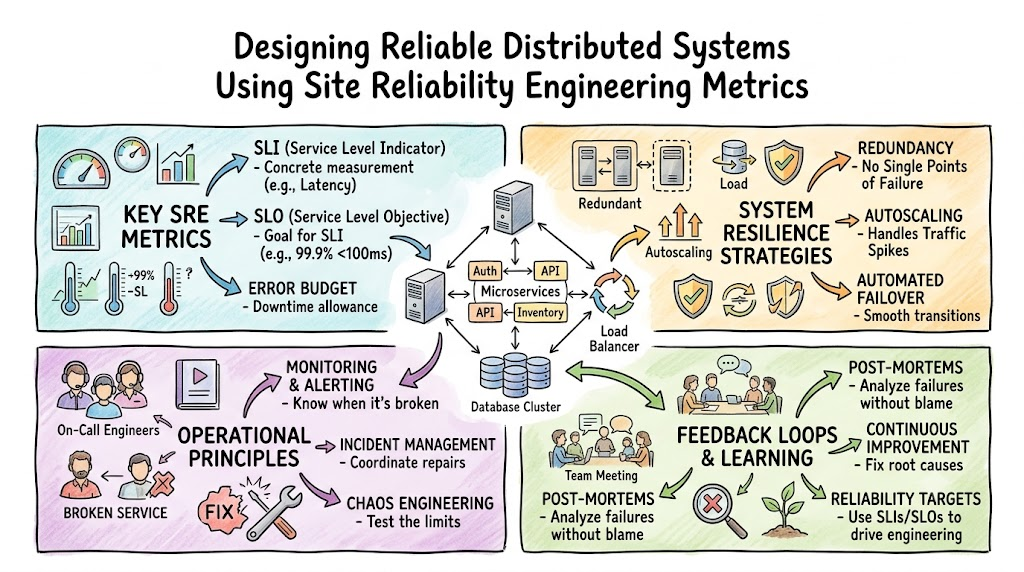
Site Reliability Engineering relies heavily on precise operational indicators to protect system availability and optimize user experiences. Without objective performance benchmarks, engineering departments frequently struggle to balance feature delivery speed with production infrastructure stability. Therefore, adopting a structured metric framework directly determines how effectively your software teams manage customer satisfaction.
Implementing a disciplined metrics architecture helps your business move away from subjective arguments regarding software performance. By using these quantitative benchmarks, modern engineering departments can easily identify system degradation before it impacts end-users. You can master these advanced operational paradigms and architectural strategies by exploring the structured courses at Sreschool.
Maintaining application health requires consistent telemetry evaluation, clear boundary definitions, and highly organized alert workflows. Consequently, organizations that establish well-defined operational targets drastically reduce chaotic firefighting during unexpected production failures. Thus, your infrastructure engineers gain deeper confidence in deployment cycles and protect key business revenue.
Defining the Core Metrics of Modern Infrastructure Engineering
Site Reliability Engineering transforms how software enterprises evaluate system health by focusing on user-centric performance indicators. Rather than monitoring generic server resource utilization, teams analyze specific transaction success rates and interface latency boundaries. This structural approach ensures that engineering efforts align directly with the actual experience of the end-user.
Establishing a reliable telemetry pipeline forms the baseline for this framework, allowing teams to collect granular service data safely. Consequently, you can track system behavior dynamically, pinpointing exact moments where software components begin to degrade under heavy load. This clear visibility allows organizations to make data-driven decisions regarding infrastructure investments and product engineering tasks.
+-------------------------------------------------------+
|                The Core Telemetry Pipeline            |
+-------------------------------------------------------+
|  1. Ingestion: Collect raw runtime events from apps   |
|  2. Aggregation: Compute rolling success percentiles  |
|  3. Evaluation: Compare performance against targets   |
+-------------------------------------------------------+
Furthermore, these systematic measurements change how business leaders and developers negotiate product release schedules. When systems perform reliably above their targets, development teams can safely accelerate feature deployment velocities without operational resistance. Therefore, clear operational metrics establish a transparent operational framework that balances business innovation with platform stability.
Ultimately, this data-driven discipline eliminates guesswork from incident management and capacity planning across your entire infrastructure. By translating technical behavior into clear operational statuses, teams can prioritize architectural refactoring tasks effectively. Thus, your organization creates a highly resilient software ecosystem capable of scaling dynamically to meet rising user demands.
Key Operational Concepts You Must Know
Understanding Service Level Objectives and Slippage
Service Level Objectives represent the explicit target metrics that define the expected reliability of your cloud applications. For instance, a team might establish an objective stating that 99.5% of API requests must return successful status codes. When the system fails to meet this specific standard, the resulting performance drop is known as metric slippage.
Managing this slippage requires real-time monitoring, automated warning systems, and clear communication channels across your development squads. If your application experiences frequent slippage, engineers must immediately pause feature deployments to focus on stability fixes. Consequently, these formal objectives act as an automated safety valve, protecting user satisfaction from long-term system decay.
Calculating and Managing Your Error Budget
An error budget represents the exact amount of service unreliability that your organization tolerates over a specific timeframe. If your team commits to a 99.9% availability objective, your application retains a 0.1% budget for allowable failures. This framework gives software developers a clear, quantifiable allowance to take calculated risks and deploy code updates faster.
+-------------------------------------------------------+
|               Total Budget Lifecycle                  |
|  [ 99.9% Required Uptime ] [ 0.1% Allowable Failure ] |
|            |                             |            |
|     (Customer Promise)             (Error Budget)     |
+-------------------------------------------------------+
However, completely consuming this budget triggers an immediate change in engineering focus, shifting all resources toward system remediation. This strict operational rule ensures that reliability remains a core feature rather than an afterthought during rapid development. Therefore, managing your budget carefully helps you maintain a stable production environment while supporting continuous product innovation.
Establishing Clear Severity Levels and Triage Frameworks
Classifying operational incidents through clear severity definitions helps on-call engineers organize their technical responses and manage resources effectively. A standard triage framework separates production issues into distinct categories based on user impact and financial risk. This systematic approach removes confusion during high-pressure situations, allowing responders to prioritize critical fixes first.
| Impact Level | System Status | Engineering Action |
|---|---|---|
| Critical | Core business functionality unavailable | Alert incident commander; assemble immediate response team. |
| Major | Non-critical features failing for many users | Notify component owners; initiate mitigation within thirty minutes. |
| Minor | Intermittent errors with a clear workaround | Log issue in product backlog; resolve during normal working hours. |
Applying this structured classification model consistently ensures that your engineering squads respond with the appropriate level of urgency. Furthermore, it sets clear expectations for business stakeholders, preventing unnecessary executive interruptions during critical remediation phases.
Designing On-Call Rotations and Escalation Paths
Creating sustainable on-call schedules protects your engineering staff from burnout while ensuring constant coverage for your cloud systems. You should distribute shifts equitably among team members, providing comprehensive handoff documentation and clear secondary backup contacts. This structure ensures that a fresh, capable engineer is always ready to address automated system alerts.
Additionally, formal escalation paths must exist for situations where the primary responder cannot resolve an incident quickly. If an issue remains unmitigated past a set timeframe, the monitoring system must automatically page a senior architect. This setup prevents individual engineers from struggling alone while service downtime metrics continue to climb.
Platform Implementation vs. Culture — What’s the Real Difference?
Deploying the Technical Tooling Infrastructure
Building a modern observability stack requires deploying automated time-series databases, log aggregators, and distributed tracing tools across your infrastructure. These technical platforms collect real-time data from runtime environments, providing the raw information needed to calculate performance metrics. However, simply installing these software packages does not automatically make your applications reliable.
Without careful configuration, monitoring platforms can generate excessive noise, overwhelming your staff with false alerts and irrelevant charts. Technical tools serve as the data collection layer, but they require human intelligence to establish meaningful threshold values. Therefore, software automation is an essential foundation, but it cannot substitute for deep operational understanding.
Cultivating a Blameless Engineering Environment
A healthy operational culture relies completely on psychological safety, ensuring that engineers can discuss production failures without fearing blame. In a blameless culture, teams view human error as an indicator of systemic vulnerabilities rather than a firing offense. This perspective encourages transparency, prompting responders to share critical technical details that help harden system architecture.
+-------------------------------------------------------+
|                 Cultural Evolution                    |
|  - Old Model: Punish the engineer who ran the command  |
|  - New Model: Fix the architecture that allowed error |
+-------------------------------------------------------+
When management punishes mistakes, engineers hide system defects, which leads to recurring outages and compounding technical debt. Conversely, combining excellent software tools with a supportive operational culture allows your organization to build truly resilient systems. Cultivating this collaborative environment ensures that your staff treats every production failure as an opportunity to learn.
Real-World Use Cases of Modern Operations
Migrating Monolithic Architecture to Resilient Microservices
A major financial services corporation experienced frequent platform-wide outages because their legacy monolithic application created single failure points. To fix this vulnerability, the architecture team broke the monolith apart into independent microservices, assigning distinct error budgets to each component. This decoupling guaranteed that a failure within the reporting module could not crash the payment gateway.
Additionally, they implemented automated circuit breakers to isolate failing services and prevent cascading performance degradation across the platform. As a result of this architectural migration, their overall system availability rose significantly, while customer complaints dropped sharply. This transformation shows how combining clear operational guardrails with isolated service designs protects essential business functions.
Mitigating Cascading Database Failures Under Peak Traffic
During a highly publicized product drop, a popular online retail platform experienced a massive traffic spike that overwhelmed its databases. The sudden increase in connection requests caused query response times to climb, triggering automated transaction retries from application servers. This compounding traffic loop created a severe cascading failure that threatened to take down the entire marketplace.
[ Spike In Users ] ---> [ Latency Rises ] ---> [ App Retries Explode ] ---> [ Database Crashes ]
Fortunately, the on-call response team spotted the bottleneck early using live dashboards and immediately implemented a rate-limiting policy. They temporarily disabled non-essential frontend features, reducing database pressure and allowing the storage clusters to recover safely. By analyzing this incident later, they designed a read-through caching layers that permanently eliminated this specific failure mode.
Common Mistakes in Operations Engineering
Misconfiguring Alerting Thresholds and Alert Fatigue
A frequent error in operations engineering is configuring monitoring software to trigger urgent pages for minor, non-actionable anomalies. When engineers receive hundreds of low-priority notifications throughout the week, they develop severe alert fatigue and miss genuine emergencies. Alerts should only fire when a system issue requires immediate human intervention to prevent service degradation.
To resolve this issue, engineering teams must review their alerting rules regularly and remove non-critical notifications from pager channels. Move low-priority warnings to asynchronous communication systems like email or chat applications to preserve your team’s focus. This practice keeps responders alert, minimizing response times when critical infrastructure failures occur.
Neglecting Post-Incident Documentation and Action Items
Failing to compile detailed incident reports after a major outage ensures that your team will eventually repeat the same mistakes. Some organizations treat service restoration as the final step, completely ignoring the post-mortem analysis needed to fix root causes. Without a structured review process, the underlying software defects remain hidden, waiting to trigger future service disruptions.
Furthermore, any corrective tasks generated during an incident review must be prioritized directly inside your primary product backlog. If these architectural remediation tasks are ignored, your production systems will continue to suffer from operational instability. Dedicating engineering time to post-incident fixes transforms operational failures into permanent platform improvements.
How to Become an Operations Expert — Career Roadmap
Mastering Foundational Systems and Automation Scripting
Building a successful career in infrastructure engineering requires a deep understanding of operating systems, networking models, and script automation. You must understand how the system kernel manages memory allocation, storage access, and process scheduling to diagnose complex bottlenecks. Additionally, mastering development languages like Python or Go allows you to replace manual tasks with scalable software solutions.
- Systems Internals: Study process isolation boundaries, virtual memory management, and file system behavior deeply.
- Network Protocols: Master the details of TCP handshakes, DNS resolution paths, and HTTP application layers.
- Script Automation: Code robust infrastructure configurations to deploy and maintain identical testing environments reliably.
Focusing heavily on these foundational skills gives you the technical competence needed to manage large-scale cloud native environments. Automation ensures your infrastructure scales predictably, eliminating manual installation mistakes and freeing up time for complex architectural design.
Deepening Cloud Infrastructure and Orchestration Skills
As you advance professionally, you must master container orchestration platforms like Kubernetes and infrastructure-as-code technologies like Terraform. These advanced tools allow you to define complex, multi-region cloud environments using declarative configuration files that support version control. Understanding these technical abstractions helps you design self-healing architectures that scale automatically based on consumer demand.
- Cluster Orchestration: Learn internal container networking models, storage volume management, and automated scaling behaviors.
- Declarative Infrastructure: Use version-controlled code templates to provision, update, and audit cloud resources safely.
- Distributed Observability: Implement end-to-end tracing tools to monitor request behavior across complex microservice networks.
Developing deep expertise in these orchestration systems allows you to manage large cloud deployments with minimal human intervention. Consequently, you can build reliable software systems that adapt dynamically to hardware failures and changing business workloads.
FAQ Section
- What is the structural difference between a metric indicator and an objective target?A metric indicator is a specific quantitative measure of system behavior, such as latency or error rates. An objective target is the target value or range bound by a timeline that the metric must achieve.
- How should engineering teams determine the correct compliance window for error budgets?Teams generally utilize a rolling thirty-day window to evaluate budget consumption, providing a balanced look at recent stability. This dynamic approach prevents distant historical failures from impacting current engineering decisions and feature deployment velocities.
- Can an application have multiple metric indicators for a single user journey?Yes, complex customer journeys like a checkout process often require measuring both transaction request latency and database success rates. Combining multiple indicators provides a complete picture of service performance during critical user interactions.
- What should engineers do when an infrastructure dependency lacks built-in monitoring?Responders should implement synthetic transaction testing to measure the dependency performance from the perspective of the application interface. This workaround provides essential visibility while your team works to add native telemetry hooks to the dependency.
- Why should product managers participate in defining service reliability objectives?Product managers understand consumer expectations and the business cost associated with unexpected application downtime. Partnering with product management ensures that reliability targets reflect actual user needs rather than arbitrary engineering goals.
Final Summary
Establishing accurate performance metrics is essential for maintaining reliable, highly available cloud systems that protect consumer trust. By defining precise objectives, managing error budgets carefully, and using structured triage levels, teams can handle incidents systematically. Balancing these technical observability tools with a supportive, blameless culture keeps your on-call responders focused, motivated, and highly effective.
As modern software architectures grow more complex, investing in automation, thorough documentation, and continuous learning remains your best defense. Embracing these core engineering methodologies helps your organization transform production failures into clear insights that drive structural resilience. Ultimately, prioritizing systematic reliability metrics allows your enterprise to innovate rapidly while delivering a dependable experience to all users.