1. Introduction & Overview
1.1 What is MTBF (Mean Time Between Failures)?
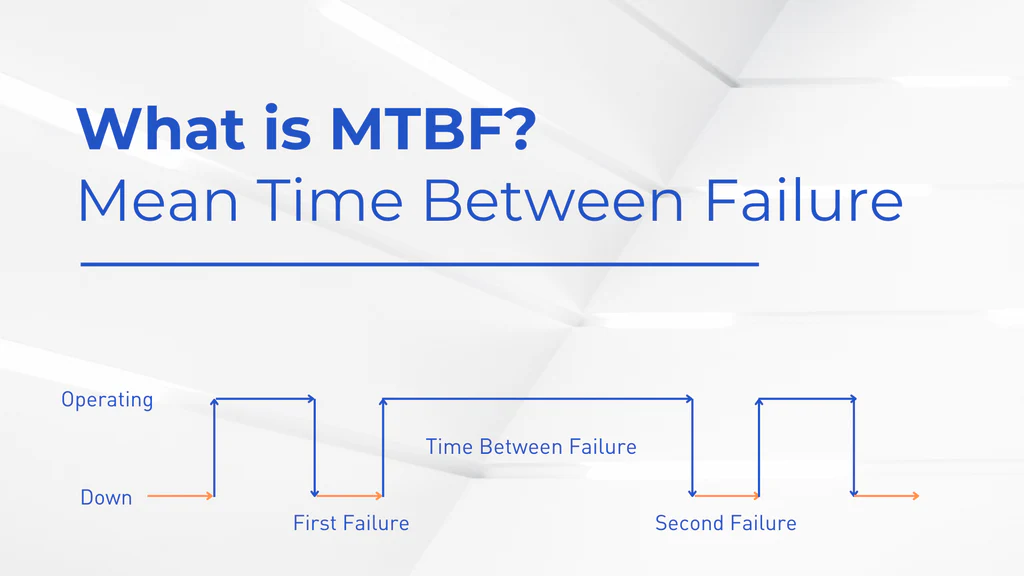
Mean Time Between Failures (MTBF) is a key reliability metric that measures the average time a system operates without failure during its operational period. It is widely used in Site Reliability Engineering (SRE) to assess system stability and uptime, helping teams ensure high availability and meet service-level objectives (SLOs).
- Definition: MTBF represents the average duration between consecutive failures of a system.
- Formula:
MTBF = Total Operational Time / Number of Failures- Unit: Typically expressed in hours.
- Example: If a server runs for 10,000 hours and experiences 5 failures, MTBF = 10,000 / 5 = 2,000 hours.
1.2 History or Background
MTBF originated in the mid-20th century in industries like aviation and military engineering, where reliability was critical for safety-critical systems. Over time, it became a cornerstone of reliability engineering and was adapted for software and IT systems in the 2000s with the rise of SRE, popularized by Google.
- Origins: Initially used for hardware reliability in mechanical and electronic systems.
- Evolution: Extended to software systems as cloud computing and DevOps practices grew.
- Modern Context: Integral to SRE for ensuring high availability in distributed systems.
1.3 Why is it Relevant in Site Reliability Engineering?
MTBF is a vital metric in SRE because it directly impacts system reliability, user experience, and operational efficiency. By tracking MTBF, SRE teams can quantify system performance, predict maintenance needs, and align with business goals like uptime SLAs (e.g., 99.99% availability).
- System Reliability: Higher MTBF indicates a more stable system.
- SLO Alignment: Helps ensure services meet agreed-upon availability targets.
- Proactive Maintenance: Guides scheduling of preventive measures to reduce downtime.
- Cost Optimization: Reduces costs associated with frequent failures and repairs.
2. Core Concepts & Terminology
2.1 Key Terms and Definitions
Understanding MTBF requires familiarity with related terms commonly used in SRE.
| Term | Definition |
|---|---|
| MTBF | Mean Time Between Failures: Average time between system failures. |
| MTTR | Mean Time To Repair: Average time taken to restore a system after a failure. |
| Availability | Percentage of time a system is operational and accessible. |
| Failure | An event where a system stops functioning as intended (e.g., service outage). |
| Reliability | Probability that a system operates without failure over a given time period. |
2.2 How it Fits into the Site Reliability Engineering Lifecycle
MTBF is embedded in multiple phases of the SRE lifecycle, from system design to continuous improvement.
- Design Phase: Engineers architect systems to maximize MTBF by using redundant components or fault-tolerant designs.
- Monitoring Phase: MTBF is tracked using observability tools to detect failure patterns.
- Incident Response: Post-incident analysis uses MTBF to identify recurring issues and improve system resilience.
- Continuous Improvement: Insights from MTBF guide optimizations, such as code refactoring or infrastructure upgrades.
3. Architecture & How It Works
3.1 Components and Internal Workflow
MTBF calculation involves collecting and analyzing failure data from operational systems. The process includes:
- Data Collection: Gathering metrics and logs from monitoring tools (e.g., Prometheus, Grafana, or AWS CloudWatch).
- Failure Identification: Defining what constitutes a failure (e.g., HTTP 500 errors, service downtime, or hardware crashes).
- Calculation: Aggregating operational time and failure counts to compute MTBF.
- Reporting: Visualizing MTBF trends in dashboards for actionable insights.
Workflow Example:
- A monitoring tool logs system uptime and failure events.
- Failures are categorized based on predefined criteria.
- Total operational time and failure counts are processed to calculate MTBF.
- Results are displayed on dashboards or used to trigger maintenance alerts.
3.2 Architecture Diagram
Below is a textual description of the MTBF workflow architecture (as image generation requires confirmation):
Diagram Description:
- Nodes:
- Data Collection: A box labeled “Data Collection (Logs, Metrics)” collects raw system data.
- Failure Identification: A box connected to the right, labeled “Failure Identification,” processes logs to detect failures.
- MTBF Calculation: A central box labeled “MTBF Calculation” computes the metric using the formula.
- Reporting: A box labeled “Reporting (Dashboards)” displays MTBF trends.
- Monitoring Tools: A box above labeled “Monitoring Tools (Prometheus, Grafana)” feeds data to the calculation.
- Actionable Insights: A box below labeled “Actionable Insights (Maintenance, Alerts)” uses MTBF for decision-making.
- Connections:
- Arrows flow from Data Collection to Failure Identification, then to MTBF Calculation, and finally to Reporting.
- Monitoring Tools connect to MTBF Calculation, and MTBF Calculation connects to Actionable Insights.
This architecture illustrates how data flows from monitoring to actionable outcomes in an SRE environment.
+-------------------+      +---------------------+      +---------------------+
|   Application     | ---> | Monitoring System   | ---> | Incident Management |
|   Servers / Cloud |      | (Prometheus/Grafana)|      | (PagerDuty/Opsgenie)|
+-------------------+      +---------------------+      +---------------------+
          |                           |                            |
          |----> Logs / Metrics ----->|                            |
          |                           |----> Alerts -------------->|
          |                           |                            |
          +---------------------------------------------------------+
                                |
                                V
                    +---------------------------+
                    |   MTBF & Reliability DB   |
                    | (Calculations, Reports)   |
                    +---------------------------+
3.3 Integration Points with CI/CD or Cloud Tools
MTBF integrates seamlessly with modern DevOps and cloud ecosystems:
- CI/CD Pipelines: Tracks deployment-related failures to adjust MTBF calculations (e.g., Jenkins, GitLab CI).
- Cloud Monitoring: Tools like AWS CloudWatch, Google Cloud Monitoring, or Azure Monitor collect metrics for MTBF.
- Alerting Systems: PagerDuty or Opsgenie use MTBF thresholds to trigger alerts for potential reliability issues.
- Observability Platforms: Datadog or New Relic aggregate failure data for real-time MTBF analysis.
4. Installation & Getting Started
4.1 Basic Setup or Prerequisites
To calculate and monitor MTBF in an SRE environment, you need:
- Monitoring Tool: Prometheus, Grafana, or a cloud-native solution like AWS CloudWatch.
- Logging System: ELK Stack (Elasticsearch, Logstash, Kibana) or similar for log aggregation.
- Failure Data Access: Permissions to access system logs and metrics.
- Scripting Knowledge: Basic proficiency in Python or Bash for data processing.
- Infrastructure: A running service or application to monitor (e.g., a web server).
4.2 Hands-on: Step-by-Step Beginner-Friendly Setup Guide
This guide sets up a basic MTBF monitoring system using Prometheus and Grafana.
Step 1: Install Prometheus
- Download and install Prometheus:
  wget https://github.com/prometheus/prometheus/releases/download/v2.47.0/prometheus-2.47.0.linux-amd64.tar.gz
  tar -xvf prometheus-2.47.0.linux-amd64.tar.gz
cd prometheus-2.47.0.linux-amd64- Configure
prometheus.ymlto scrape metrics from your application:
  scrape_configs:
    - job_name: 'my_app'
      static_configs:
- targets: ['localhost:8080']- Start Prometheus:
./prometheus --config.file=prometheus.ymlStep 2: Install Grafana
- Install Grafana (on Ubuntu):
  sudo apt-get install -y grafana
sudo systemctl start grafana-server- Access Grafana at
http://localhost:3000and log in (default: admin/admin).
Step 3: Define Failure Metrics
- Configure your application to expose metrics (e.g., HTTP 500 errors).
- Example for a Node.js app using
prom-client:
  const prom = require('prom-client');
  const counter = new prom.Counter({
    name: 'app_failures_total',
    help: 'Total number of application failures'
  });
  // Increment on failure
  counter.inc();
Step 4: Calculate MTBF
- Use a script to compute MTBF from Prometheus metrics.
- Example Python script:
  import requests
  from datetime import datetime

  def get_failure_count():
      response = requests.get('http://localhost:9090/api/v1/query?query=app_failures_total')
      return int(response.json()['data']['result'][0]['value'][1])

  def get_operational_time():
      # Assume system uptime in hours (replace with actual metric)
      return 10000  # Example: 10,000 hours

  failures = get_failure_count()
  operational_time = get_operational_time()
  mtbf = operational_time / failures if failures > 0 else float('inf')
  print(f"MTBF: {mtbf} hours")
Step 5: Visualize in Grafana
- Add Prometheus as a data source in Grafana.
- Create a dashboard to display MTBF using a query like:
sum(uptime_seconds) / sum(app_failures_total)Step 6: Set Alerts
- Configure alerts in Grafana or PagerDuty for low MTBF thresholds.
5. Real-World Use Cases
5.1 Scenario 1: E-Commerce Platform
- Context: An e-commerce platform must maintain 99.99% uptime during peak shopping seasons.
- MTBF Application: Monitors server failures to ensure high availability. If MTBF drops below 5,000 hours, SRE teams investigate and optimize load balancers.
- Outcome: Reduced downtime during Black Friday sales, improving customer satisfaction.
5.2 Scenario 2: Cloud-Based SaaS Application
- Context: A SaaS provider tracks API reliability for enterprise clients.
- MTBF Application: Uses MTBF to measure API endpoint failures, integrating with AWS CloudWatch to collect metrics.
- Outcome: Identified a recurring database connection issue, increasing MTBF by 30% after optimization.
5.3 Scenario 3: Financial Services
- Context: A banking application requires high reliability for transaction processing.
- MTBF Application: Tracks MTBF to detect hardware failures in on-premises servers.
- Outcome: Scheduled preventive maintenance, reducing outages by 25%.
5.4 Scenario 4: Streaming Service
- Context: A video streaming platform needs minimal buffering interruptions.
- MTBF Application: Monitors content delivery network (CDN) failures to maintain streaming quality.
- Outcome: Improved MTBF by upgrading CDN nodes, enhancing user experience.
6. Benefits & Limitations
6.1 Key Advantages
- Reliability Insights: Quantifies system stability, aiding SLO compliance.
- Proactive Maintenance: Enables predictive maintenance to prevent failures.
- Cost Efficiency: Reduces downtime-related losses.
- Scalability: Applicable to both hardware and software systems.
6.2 Common Challenges or Limitations
- Data Accuracy: Requires precise failure detection, which can be challenging in complex systems.
- Limited Scope: Does not account for repair time (use MTTR for that).
- Assumes Steady State: May not apply to systems with frequent changes.
- Interpretation: High MTBF doesn’t guarantee zero downtime.
7. Best Practices & Recommendations
7.1 Security Tips
- Secure monitoring tools with authentication and encryption (e.g., TLS for Prometheus).
- Restrict access to failure logs to prevent data leaks.
7.2 Performance
- Use efficient metric collection to minimize system overhead.
- Aggregate data periodically to avoid overwhelming monitoring systems.
7.3 Maintenance
- Regularly review failure definitions to ensure relevance.
- Update MTBF thresholds based on system upgrades.
7.4 Compliance Alignment
- Align MTBF tracking with standards like ISO 27001 for IT reliability.
- Document MTBF processes for audits.
7.5 Automation Ideas
- Automate MTBF calculations using scripts integrated with CI/CD pipelines.
- Set up automated alerts for low MTBF using tools like PagerDuty.
8. Comparison with Alternatives
| Metric/Tool | Description | Strengths | Weaknesses | When to Use |
|---|---|---|---|---|
| MTBF | Measures average time between failures. | Simple, widely used, predictive. | Ignores repair time, assumes stability. | For reliability-focused systems. |
| MTTR | Measures average time to repair a failure. | Focuses on recovery speed. | Doesn’t address failure frequency. | For systems prioritizing fast recovery. |
| Availability | Percentage of time a system is operational. | Directly tied to SLOs. | Broad metric, less granular. | For high-level SLA reporting. |
| Failure Rate | Frequency of failures per unit time. | Useful for unstable systems. | Less focus on operational time. | For rapidly changing environments. |
When to Choose MTBF:
- Use MTBF when the focus is on reducing failure frequency in stable systems.
- Prefer MTTR for minimizing downtime or Availability for SLA reporting.
9. Conclusion
9.1 Final Thoughts
MTBF is a cornerstone of SRE, providing actionable insights into system reliability. By integrating MTBF into monitoring and maintenance workflows, teams can enhance uptime, meet SLOs, and improve user satisfaction. Its simplicity and predictive power make it invaluable for both hardware and software systems.
9.2 Future Trends
- AI-Driven Analysis: Machine learning models to predict failures and optimize MTBF.
- Real-Time Monitoring: Enhanced integration with cloud-native observability tools.
- Cross-System Metrics: Combining MTBF with other metrics like MTTR for holistic reliability.
9.3 Next Steps
- Start by setting up Prometheus and Grafana to monitor MTBF.
- Experiment with failure thresholds and automate alerts.
- Join SRE communities for best practices and updates.
9.4 Resources
- Official Docs: Prometheus (https://prometheus.io/docs), Grafana (https://grafana.com/docs)
- Communities: SRE Reddit (r/sre), CNCF Slack (https://slack.cncf.io)
- Further Reading: “Site Reliability Engineering” by Google (O’Reilly)