Introduction & Overview
In the fast-paced world of Site Reliability Engineering (SRE), ensuring rapid and effective incident response is critical to maintaining system reliability and user satisfaction. Escalation chains are a cornerstone of incident management, providing a structured process to ensure issues are promptly addressed by the right teams or individuals. This tutorial offers an in-depth exploration of escalation chains, covering their definition, implementation, and practical applications in SRE. By the end, readers will understand how to design, implement, and optimize escalation chains to enhance system reliability.
What is an Escalation Chain?
An escalation chain is a predefined sequence of steps and stakeholders involved in resolving an incident when it cannot be addressed by the initial responder. It ensures issues are systematically escalated to higher-tier support or specialized teams, minimizing downtime and impact on users.
- Purpose: To streamline incident resolution by defining clear paths for escalation, ensuring timely and efficient responses.
- Key Components: Trigger conditions, notification methods, escalation tiers, and stakeholder responsibilities.
- Example: An on-call engineer receives an alert, attempts a fix, and escalates to a senior engineer if unresolved within a set time.
History or Background
Escalation chains evolved from traditional IT service management (ITSM) practices, where manual processes often led to delays in incident resolution. With the rise of SRE, pioneered by Google in the early 2000s, escalation chains became formalized as a critical component of automated and scalable incident management. Tools like PagerDuty and Opsgenie further refined escalation chains by integrating automation and real-time notifications, addressing the limitations of manual escalation in complex, distributed systems.
- Pre-SRE Era: In traditional IT operations, incidents were handled manually (phone calls, emails, spreadsheets). Escalations often failed due to lack of automation.
- SRE Evolution: Google popularized SRE, introducing structured Incident Response Playbooks. Escalation chains became standard to reduce downtime.
- Modern Era: Today, tools like PagerDuty, Opsgenie, and Squadcast provide automated escalation policies integrated with CI/CD and cloud monitoring systems.
Why is it Relevant in Site Reliability Engineering?
In SRE, where reliability is paramount, escalation chains play a pivotal role in minimizing service disruptions. They align with SRE principles like reducing toil through automation and fostering a blameless culture by ensuring clear roles and responsibilities during incidents. Escalation chains are especially critical in:
- High-Availability Systems: Ensuring rapid response to outages in systems with 99.9%+ uptime requirements.
- Distributed Environments: Coordinating responses across geographically dispersed teams.
- Cloud-Native Architectures: Handling incidents in dynamic, containerized environments like Kubernetes.
Core Concepts & Terminology
Key Terms and Definitions
| Term | Definition |
|---|---|
| Escalation Chain | A sequence of steps defining who to notify and when during an incident. |
| Service Level Indicator (SLI) | A measurable metric (e.g., latency, error rate) used to trigger escalations. |
| Service Level Objective (SLO) | A target value for an SLI, defining acceptable performance levels. |
| Error Budget | Allowable downtime or errors, influencing escalation urgency. |
| Toil | Repetitive manual tasks that escalation chains aim to reduce through automation. |
| On-Call Rotation | A schedule assigning engineers to respond to incidents, often the first step in an escalation chain. |
| Incident Response | The process of detecting, responding to, and resolving system issues, guided by escalation chains. |
How It Fits into the Site Reliability Engineering Lifecycle
Escalation chains are integral to the incident management phase of the SRE lifecycle, which includes monitoring, incident response, postmortems, and continuous improvement. They ensure:
- Proactive Detection: Alerts tied to SLIs/SLOs trigger the chain.
- Structured Response: Clear escalation paths reduce chaos during incidents.
- Learning and Improvement: Post-incident reviews refine escalation policies.
Architecture & How It Works
Components
An escalation chain typically includes:
- Triggers: Alerts based on SLIs (e.g., error rate > 1% for 5 minutes).
- Notification Methods: Email, SMS, push notifications, or integrations with tools like Slack or PagerDuty.
- Escalation Tiers: Levels of support (e.g., Tier 1: On-call engineer, Tier 2: Senior engineer, Tier 3: Infrastructure team).
- Timeout Rules: Time limits for each tier to respond before escalating to the next.
- Runbooks: Documentation guiding responders through troubleshooting steps.
Internal Workflow
- Incident Detection: Monitoring tools (e.g., Prometheus) detect an anomaly and trigger an alert.
- Initial Notification: The on-call engineer is notified via PagerDuty or Opsgenie.
- Tier 1 Response: The engineer attempts to resolve the issue using a runbook.
- Escalation: If unresolved within a timeout (e.g., 15 minutes), the issue escalates to Tier 2.
- Resolution or Further Escalation: The process continues until the issue is resolved or reaches the highest tier.
- Postmortem: After resolution, a blameless postmortem refines the escalation chain.
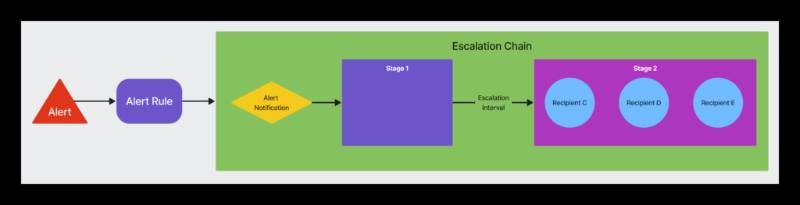
Architecture Diagram
Below is a textual description of an escalation chain architecture diagram, as image generation is not possible:
[Monitoring System: Prometheus/Grafana]
         |
         | (SLI: Error rate > 1% for 5 min)
         v
[Alerting Tool: PagerDuty/Opsgenie]
         |
         | (Notify via SMS/Email/Slack)
         v
[Tier 1: On-Call Engineer]
         | (15-min timeout)
         | (Runbook: Check logs, restart service)
         v
[Tier 2: Senior Engineer]
         | (30-min timeout)
         | (Runbook: Debug code, scale resources)
         v
[Tier 3: Infrastructure Team]
         | (Runbook: Reconfigure network, restore DB)
         v
[Resolution or Postmortem]
Integration Points with CI/CD or Cloud Tools
- CI/CD: Escalation chains integrate with CI/CD pipelines to trigger alerts for failed deployments or performance degradation. For example, a Jenkins pipeline can notify PagerDuty if a build fails.
- Cloud Tools: AWS CloudWatch or Google Cloud Monitoring can feed SLIs into the escalation chain, with AWS SNS handling notifications.
- Container Orchestration: Kubernetes events (e.g., pod crashes) can trigger escalations via tools like Prometheus.
Installation & Getting Started
Basic Setup or Prerequisites
- Monitoring Tools: Install Prometheus and Grafana for SLI monitoring.
- Alerting Platform: Use PagerDuty, Opsgenie, or VictorOps for notifications.
- Communication Tools: Configure Slack or email for alerts.
- Skills Required: Basic knowledge of scripting (e.g., Python, Bash) and cloud platforms (AWS, GCP, Azure).
- Access: Ensure team members have access to alerting tools and runbooks.
Hands-On: Step-by-Step Beginner-Friendly Setup Guide
This guide sets up a basic escalation chain using PagerDuty and Prometheus.
- Install Prometheus:
- Download and install Prometheus from prometheus.io.
- Configure a basic
prometheus.ymlfile:
global:
  scrape_interval: 15s
scrape_configs:
  - job_name: 'my_app'
    static_configs:
      - targets: ['localhost:8080']
Start Prometheus: ./prometheus --config.file=prometheus.yml.
2. Set Up PagerDuty:
- Sign up for a PagerDuty account and create a service.
- Generate an integration key for Prometheus.
- Configure an escalation policy:
- Tier 1: On-call engineer (notify via SMS, 15-min timeout).
- Tier 2: Senior engineer (notify via email, 30-min timeout).
3. Integrate Prometheus with PagerDuty:
- Install Alertmanager and configure it to send alerts to PagerDuty:
global:
  resolve_timeout: 5m
route:
  receiver: 'pagerduty'
receivers:
  - name: 'pagerduty'
    pagerduty_configs:
- service_key: '<your_pagerduty_integration_key>'- Start Alertmanager:
./alertmanager --config.file=alertmanager.yml.
4. Define an Alert Rule:
- Create a
rules.ymlfile in Prometheus:
groups:
- name: example
  rules:
  - alert: HighErrorRate
    expr: rate(http_requests_total{status="500"}[5m]) > 0.01
    for: 5m
    labels:
      severity: critical
    annotations:
      summary: "High error rate detected"
Load the rule: promtool check rules rules.yml.
5. Test the Escalation Chain:
- Simulate a high error rate by generating 500 errors on your app.
- Verify that PagerDuty notifies the on-call engineer and escalates if needed.
Real-World Use Cases
Scenario 1: E-Commerce Platform Outage
- Context: A major e-commerce platform experiences a spike in 500 errors during a flash sale.
- Escalation Chain:
- Tier 1: On-call engineer checks logs and restarts the web server.
- Tier 2: Senior engineer identifies a database bottleneck and scales the RDS instance.
- Tier 3: Infrastructure team reconfigures load balancers to handle traffic.
- Outcome: Downtime reduced from 1 hour to 15 minutes, preserving revenue.
Scenario 2: Financial Services Data Breach
- Context: A financial services company detects unauthorized API access.
- Escalation Chain:
- Tier 1: On-call engineer blocks the suspicious IP.
- Tier 2: Security engineer analyzes logs for breach scope.
- Tier 3: Incident response team coordinates with legal and PR teams.
- Outcome: Breach contained within 30 minutes, with a postmortem improving future detection.
Scenario 3: Cloud-Native Microservices Failure
- Context: A Kubernetes-based microservices app experiences pod crashes.
- Escalation Chain:
- Tier 1: On-call engineer uses a runbook to check pod logs.
- Tier 2: DevOps engineer debug Kubernetes configuration.
- Tier 3: Cloud architect adjusts resource quotas.
- Outcome: Service restored in 20 minutes, with autoscaling policies updated.
Industry-Specific Example: Healthcare
- Context: A hospital’s patient management system fails during peak hours.
- Escalation Chain:
- Tier 1: IT staff resets the application.
- Tier 2: SRE team identifies a memory leak in the app.
- Tier 3: Vendor team patches the software.
- Outcome: System restored in 25 minutes, ensuring patient care continuity.
Benefits & Limitations
Key Advantages
- Faster Incident Resolution: Clear escalation paths reduce response times.
- Reduced Toil: Automation minimizes manual intervention.
- Improved Collaboration: Defined roles enhance teamwork across departments.
- Customer Trust: Quick resolutions maintain user satisfaction.
Common Challenges or Limitations
- Over-Escalation: Frequent escalations can overwhelm higher tiers.
- Configuration Complexity: Setting up chains requires careful planning.
- Dependency on Tools: Reliance on PagerDuty or Opsgenie can lead to vendor lock-in.
- Human Factors: Fatigue in on-call rotations can delay responses.
Best Practices & Recommendations
- Security Tips:
- Encrypt notification channels (e.g., use HTTPS for webhooks).
- Restrict access to escalation tools to authorized personnel.
- Performance:
- Set realistic timeouts (e.g., 15–30 minutes per tier).
- Monitor escalation chain performance using metrics like mean time to resolution (MTTR).
- Maintenance:
- Regularly update runbooks to reflect system changes.
- Conduct chaos engineering to test escalation effectiveness.
- Compliance Alignment:
- Ensure escalation chains comply with regulations like GDPR or HIPAA for sensitive data.
- Document all escalations for audit trails.
- Automation Ideas:
- Use AI to prioritize alerts based on severity.
- Automate runbook execution for common issues.
Comparison with Alternatives
| Feature/Tool | Escalation Chains (PagerDuty/Opsgenie) | Manual Escalation | ITSM (ServiceNow) |
|---|---|---|---|
| Automation | High (automated notifications, timeouts) | Low (manual calls/emails) | Medium (workflow-based) |
| Scalability | Excellent (cloud-native integration) | Poor (human-dependent) | Good (enterprise-focused) |
| Setup Complexity | Moderate (requires configuration) | Low (ad-hoc) | High (extensive customization) |
| Cost | Subscription-based | None | High (licensing fees) |
| Use Case | SRE, DevOps, cloud environments | Small teams | Large enterprises |
When to Choose Escalation Chains
- Choose Escalation Chains: For automated, scalable incident response in cloud-native or distributed systems.
- Choose Alternatives: Manual escalation for small teams with simple systems; ITSM for enterprises needing complex workflows.
Conclusion
Escalation chains are a vital tool in SRE, enabling rapid, structured, and automated incident response. By integrating with monitoring and CI/CD tools, they ensure reliability in complex systems. Future trends may include AI-driven escalation prioritization and tighter integration with observability platforms. To get started, explore tools like PagerDuty or Opsgenie and experiment with small-scale chains.
- Official Docs:
- PagerDuty: pagerduty.com
- Opsgenie: atlassian.com/software/opsgenie
- Communities:
- SRE Reddit: reddit.com/r/sre
- Google SRE Book: sre.google