Introduction & Overview
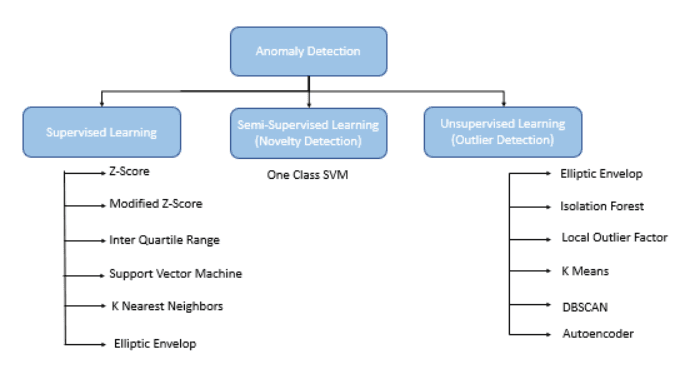
What is Anomaly Detection?
Anomaly detection is the process of identifying patterns or data points in a system that deviate significantly from expected behavior. In Site Reliability Engineering (SRE), it plays a critical role in monitoring systems to detect issues such as performance degradation, security breaches, or infrastructure failures before they impact users. By leveraging statistical methods or machine learning (ML), anomaly detection ensures systems remain reliable and performant.
History or Background
Anomaly detection originated in statistical process control and early data analysis techniques used in manufacturing and finance. In the context of SRE, it gained prominence with the rise of distributed systems, cloud computing, and microservices architectures. Early approaches relied on static thresholds (e.g., alerting if CPU usage exceeds 80%), but modern systems use advanced ML techniques like Isolation Forests, Autoencoders, and time-series forecasting to handle dynamic, large-scale environments.
- 1960s – 1980s: Basic threshold monitoring in mainframe systems.
- 1990s – 2000s: Rule-based monitoring in large enterprise IT systems.
- 2010s: Machine Learning introduced anomaly detection for cloud-native systems.
- 2020s – Now: AI/ML-driven AIOps and SRE practices use real-time anomaly detection across distributed microservices, containers, and Kubernetes.
Why is it Relevant in Site Reliability Engineering?
Anomaly detection is a cornerstone of SRE because it supports the core goal of maintaining system reliability and availability. Its relevance stems from:
- Proactive Issue Detection: Identifies potential problems before they cause outages.
- Resource Optimization: Detects inefficiencies in resource usage, such as overprovisioned servers.
- Security Monitoring: Flags unusual patterns that may indicate intrusions or data breaches.
- Data-Driven Decisions: Provides insights for incident response and capacity planning.
Core Concepts & Terminology
Key Terms and Definitions
- Anomaly: A data point or pattern that deviates significantly from expected behavior, such as a sudden spike in latency.
- Time-Series Data: Sequential data collected over time, common in SRE for metrics like CPU usage, memory, or request rates.
- Thresholding: A rule-based approach to flag anomalies when metrics exceed predefined limits.
- Machine Learning-Based Detection: Algorithms that learn normal system behavior and detect deviations (e.g., Prophet, Autoencoders).
- False Positive/Negative: False positives incorrectly flag normal behavior as anomalous; false negatives miss actual anomalies.
| Term | Definition | SRE Context Example |
|---|---|---|
| Baseline | Normal operating range of metrics | Average CPU load between 40-60% |
| Anomaly | Deviation from baseline | Sudden spike to 95% CPU |
| False Positive | Incorrectly flagged anomaly | Alert triggered during expected deployment |
| False Negative | Missed anomaly | Slow database response not flagged |
| MTTR | Mean Time to Recovery | Anomaly detection reduces MTTR |
| AIOps | AI for IT Operations | ML-powered anomaly detection |
How It Fits into the SRE Lifecycle
Anomaly detection integrates into multiple phases of the SRE lifecycle:
- Monitoring: Continuously analyzes metrics and logs to detect deviations in real time.
- Incident Response: Triggers alerts for rapid investigation and mitigation of issues.
- Postmortems: Helps identify root causes by analyzing anomalous patterns during incidents.
- Capacity Planning: Detects trends indicating resource constraints, aiding in scaling decisions.
Architecture & How It Works
Components and Internal Workflow
An anomaly detection system in SRE typically includes:
- Data Ingestion: Collects metrics, logs, or traces from systems using tools like Prometheus, Fluentd, or ELK Stack.
- Preprocessing: Cleans and normalizes data (e.g., handling missing values, aggregating metrics).
- Anomaly Detection Engine: Applies algorithms (statistical rules or ML models) to identify outliers.
- Alerting and Visualization: Sends notifications via tools like PagerDuty and visualizes results in dashboards (e.g., Grafana).
Architecture Diagram
The architecture of an anomaly detection system can be visualized as a pipeline with the following components, connected in sequence:
- Data Sources: Metrics (e.g., CPU usage), logs (e.g., application errors), and traces (e.g., request paths) from applications or infrastructure.
- Data Ingestion: Tools like Prometheus or Fluentd collect and aggregate data.
- Preprocessing: Data is normalized and aggregated for analysis (e.g., converting timestamps, averaging metrics).
- Anomaly Detection Engine: Statistical rules or ML models (e.g., Prophet, Isolation Forest) process data to identify anomalies.
- Alerting and Visualization: Anomalies trigger alerts (e.g., via PagerDuty) and are displayed on dashboards (e.g., Grafana).
+-------------------+      +------------------+      +------------------+
|   Data Sources    | ---> | Data Ingestion   | ---> | Detection Engine |
| (Logs, Metrics,   |      | (Prometheus,     |      | (ML/Statistical) |
|  Traces, Events)  |      |  Fluentd, etc.)  |      |                  |
+-------------------+      +------------------+      +------------------+
                                                               |
                                                               v
                                                     +------------------+
                                                     | Alerting &       |
                                                     | Notification     |
                                                     | (Slack, PagerDuty)|
                                                     +------------------+
                                                               |
                                                               v
                                                     +------------------+
                                                     | Automated         |
                                                     | Remediation       |
                                                     | (Rollback, Scale) |
                                                     +------------------+
Diagram Description (since images cannot be generated directly):
Imagine a flowchart with five boxes, each representing a component. Arrows connect the boxes from left to right: “Data Sources” → “Data Ingestion” → “Preprocessing” → “Anomaly Detection Engine” → “Alerting & Visualization”. Each box includes a brief label of its function (e.g., “Prometheus, Fluentd” for Data Ingestion).
Integration Points with CI/CD or Cloud Tools
- CI/CD Pipelines: Monitor pipeline performance (e.g., build times, failure rates) using tools like Jenkins or GitLab CI.
- Cloud Platforms: Integrate with cloud monitoring tools like AWS CloudWatch, Google Cloud Monitoring, or Azure Monitor to feed metrics into the anomaly detection system.
- Orchestration Tools: Analyze Kubernetes or Docker metrics to detect container-level anomalies, such as pod crashes or resource exhaustion.
Installation & Getting Started
Basic Setup or Prerequisites
To set up a basic anomaly detection system using Prometheus and the Prophet ML library:
- Software:
- Prometheus (for metric collection)
- Grafana (for visualization)
- Python 3.8+ (for running ML models)
- Prophet library (for time-series forecasting)
- Hardware: A server with at least 4GB RAM and 2 CPUs.
- Dependencies: Install Python packages using
pip install prophet pandas.
Hands-On: Step-by-Step Beginner-Friendly Setup Guide
- Install Prometheus:
   wget https://github.com/prometheus/prometheus/releases/download/v2.37.0/prometheus-2.37.0.linux-amd64.tar.gz
   tar xvfz prometheus-2.37.0.linux-amd64.tar.gz
   cd prometheus-2.37.0.linux-amd64
./prometheus --config.file=prometheus.yml- Configure Prometheus: Edit
prometheus.ymlto scrape metrics from your application.
   scrape_configs:
     - job_name: 'my_app'
       static_configs:
- targets: ['localhost:9090']- Install Prophet:
pip install prophet- Write a Python Script for Anomaly Detection:
   import pandas as pd
   from prophet import Prophet
   from prometheus_client import Gauge, start_http_server

   # Fetch data from Prometheus (replace with actual query)
   data = pd.read_csv('metrics.csv')  # Example: CPU usage data
   df = pd.DataFrame({'ds': data['timestamp'], 'y': data['value']})

   # Fit Prophet model
   model = Prophet()
   model.fit(df)

   # Predict and detect anomalies
   future = model.make_future_dataframe(periods=60)
   forecast = model.predict(future)
   anomalies = forecast[forecast['yhat_upper'] < df['y']]

   # Export anomalies to Prometheus
   start_http_server(8000)
   anomaly_gauge = Gauge('anomalies_detected', 'Detected anomalies')
anomaly_gauge.set(len(anomalies))- Visualize in Grafana: Connect Grafana to Prometheus, create a dashboard, and add a panel to visualize the
anomalies_detectedmetric.
Real-World Use Cases
Scenario 1: Detecting Application Latency Spikes
An e-commerce platform monitors API response times using Prometheus and an ML-based anomaly detection model. A sudden spike in latency (e.g., from 100ms to 500ms) triggers an alert, allowing the SRE team to investigate and identify a database query bottleneck, which is resolved by optimizing indexes.
Scenario 2: Security Intrusion Detection
A financial services company uses anomaly detection to analyze authentication logs. An ML model flags unusual login patterns (e.g., multiple failed attempts from an unfamiliar IP), preventing a potential data breach by triggering a security response.
Scenario 3: Infrastructure Resource Monitoring
A cloud provider monitors CPU and memory usage across Kubernetes clusters. Anomaly detection identifies overutilized nodes (e.g., CPU usage consistently above 90%), enabling the SRE team to redistribute workloads and prevent performance degradation.
Industry-Specific Example: Healthcare
In healthcare, anomaly detection monitors patient monitoring systems (e.g., heart rate monitors). A sudden deviation in vital signs (e.g., irregular heart rate) triggers an alert, enabling rapid medical intervention.
Benefits & Limitations
Key Advantages
- Proactive Issue Detection: Identifies problems before they impact users, reducing downtime.
- Scalability: Handles large-scale, distributed systems with high data volumes.
- Automation: Reduces manual monitoring efforts by automating anomaly detection and alerting.
Common Challenges or Limitations
- False Positives: Over-alerting can lead to alert fatigue, requiring careful tuning.
- Data Quality: Poor or noisy data can reduce detection accuracy.
- Complexity: ML-based systems require expertise to configure, train, and maintain.
Best Practices & Recommendations
Security Tips
- Encrypt data pipelines to protect sensitive metrics and logs.
- Restrict access to anomaly detection dashboards and alerts using role-based access control (RBAC).
Performance and Maintenance
- Use efficient algorithms (e.g., Isolation Forests for high-dimensional data) to reduce compute overhead.
- Retrain ML models periodically to adapt to evolving system behavior.
Compliance Alignment and Automation
- Align with compliance standards like GDPR or HIPAA for handling sensitive data.
- Automate anomaly detection workflows using tools like Ansible or Terraform to streamline deployment and maintenance.
Comparison with Alternatives
| Approach | Pros | Cons | When to Use |
|---|---|---|---|
| Rule-Based Thresholding | Simple, fast, easy to implement | Limited to known patterns, inflexible | Small-scale systems with stable metrics |
| Statistical Methods | Interpretable, lightweight | Struggles with complex, non-linear data | Time-series metrics with clear patterns |
| ML-Based (e.g., Prophet, Autoencoders) | Handles complex, dynamic patterns | Requires training, higher compute cost | Large-scale, dynamic systems |
When to Choose Anomaly Detection
- Use ML-based anomaly detection for complex, dynamic systems where rule-based approaches fail due to unpredictable patterns.
- Opt for rule-based or statistical methods for smaller systems with well-defined, stable metrics.
Conclusion
Anomaly detection is a vital tool for SRE teams, enabling proactive monitoring, rapid incident response, and efficient resource management. As systems grow in complexity, advancements in ML and real-time analytics will further enhance its capabilities. SRE teams should start with simple setups (e.g., Prometheus and Prophet) and scale to advanced tools as needed.
For further learning, explore:
- Prometheus Documentation: https://prometheus.io/docs
- Prophet Documentation: https://facebook.github.io/prophet/docs
- SRE Community: https://sre.google/community
Future Trends: Expect increased adoption of AI-driven anomaly detection, integration with observability platforms, and real-time analytics for faster incident resolution.