Introduction & Overview
What is OpenTelemetry?
OpenTelemetry (OTel) is an open-source, vendor-neutral observability framework designed to collect, process, and export telemetry data, including traces, metrics, and logs, from applications and infrastructure. It provides standardized APIs, SDKs, and tools to instrument applications, enabling Site Reliability Engineers (SREs) to monitor, debug, and optimize distributed systems effectively. OpenTelemetry is a Cloud Native Computing Foundation (CNCF) project, ensuring broad adoption and community support.
History or Background
OpenTelemetry was formed in 2019 through the merger of two observability projects: OpenTracing and OpenCensus. OpenTracing focused on distributed tracing, while OpenCensus emphasized metrics and stats collection. The consolidation under CNCF created a unified, standardized framework to address the limitations of both projects, offering a single set of APIs and tools for comprehensive observability. Today, OpenTelemetry is widely adopted across industries, supported by major observability vendors like Prometheus, Jaeger, and commercial platforms such as Datadog and New Relic.
Why is it Relevant in Site Reliability Engineering?
Site Reliability Engineering emphasizes automation, reliability, and performance in managing large-scale systems. OpenTelemetry is critical for SREs because:
- Unified Observability: It collects metrics, logs, and traces in a standardized format, enabling holistic system monitoring.
- Vendor Neutrality: Avoids lock-in, allowing SREs to choose or switch backends (e.g., Prometheus, Jaeger) without re-instrumenting code.
- Scalability: Supports complex, cloud-native architectures like microservices and Kubernetes, common in SRE-managed environments.
- Incident Response: Provides detailed telemetry for rapid troubleshooting, reducing Mean Time to Resolution (MTTR).
- Golden Signals: Enables monitoring of latency, errors, traffic, and saturation, aligning with SRE’s “Golden Signals” methodology.
Core Concepts & Terminology
Key Terms and Definitions
- Telemetry: Data (metrics, logs, traces) automatically collected from systems for monitoring and analysis.
- Traces: Records of a request’s journey through a system, composed of spans that capture individual operations.
- Span: A single unit of work in a trace, including metadata like start time, duration, and attributes.
- Metrics: Quantitative measurements (e.g., CPU usage, request latency) for assessing system health.
- Logs: Event records providing detailed context for debugging and auditing.
- OpenTelemetry Collector: A vendor-agnostic service that receives, processes, and exports telemetry data.
- OTLP (OpenTelemetry Protocol): A standardized protocol for transmitting telemetry data.
- Context Propagation: Mechanism to correlate telemetry across services by passing trace IDs and span IDs.
- Instrumentation: Adding code or agents to applications to generate telemetry data, either manually or automatically.
| Term | Definition | Relevance in SRE |
|---|---|---|
| Trace | A record of the execution path of a request as it travels through services | Helps identify bottlenecks |
| Span | A unit of work within a trace (e.g., a DB query, API call) | Pinpoints slow operations |
| Metrics | Numeric time-series data (e.g., CPU, request latency) | Tracks SLI compliance |
| Logs | Timestamped records of events | Used for debugging & audits |
| Context Propagation | Carries trace IDs across services | Ensures distributed trace continuity |
| Collector | Service that receives, processes, and exports telemetry | Decouples data collection from storage |
| Instrumentation | Process of adding code/agents to capture telemetry | Automates monitoring setup |
How It Fits into the Site Reliability Engineering Lifecycle
OpenTelemetry integrates into the SRE lifecycle across several phases:
- Design and Development: SREs use OpenTelemetry to instrument applications for observability during development, ensuring telemetry is embedded early.
- Deployment: Telemetry data validates CI/CD pipeline performance and monitors deployment health.
- Monitoring and Incident Response: Traces and metrics help identify bottlenecks and root causes during incidents, supporting SLA/SLO compliance.
- Post-Mortem Analysis: Logs and traces provide detailed insights for analyzing failures and improving system reliability.
- Capacity Planning: Metrics enable SREs to forecast resource needs and optimize infrastructure.
Architecture & How It Works
Components and Internal Workflow
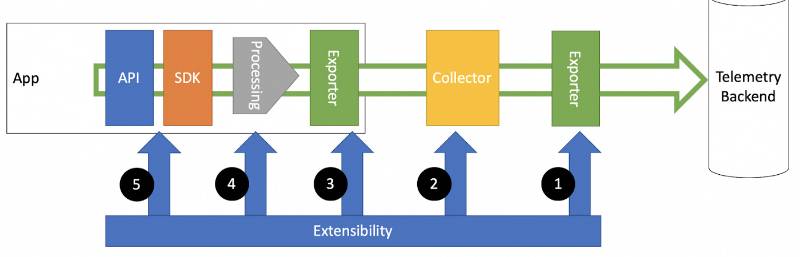
OpenTelemetry’s architecture is modular, consisting of:
- APIs: Language-specific interfaces for instrumenting code to collect telemetry data.
- SDKs: Implementations of APIs that process and export telemetry data (e.g., Java, Python, Go SDKs).
- Instrumentation Libraries: Pre-built plugins for frameworks (e.g., Spring, Django) to enable automatic instrumentation.
- Collector: A standalone service that receives, processes, and exports telemetry data to backends.
- Exporters: Components that send telemetry to observability platforms (e.g., Prometheus, Jaeger).
- Receivers: Modules in the Collector that ingest data via protocols like OTLP, Jaeger, or Zipkin.
- Processors: Transform telemetry data (e.g., batching, filtering) before export.
- OTLP: The native protocol for transmitting telemetry data.
Workflow:
- Applications are instrumented using APIs/SDKs or auto-instrumentation libraries.
- Telemetry data (traces, metrics, logs) is generated and sent to the Collector via receivers.
- The Collector processes data (e.g., filtering, batching) and exports it to backends using exporters.
- Backends (e.g., Prometheus, Jaeger) store, analyze, and visualize the data for SREs.
Architecture Diagram
Below is a textual representation of the OpenTelemetry architecture (image not possible in this format):
+-------------------+       +------------------+       +----------------------+
|  Application Code | --->  | Instrumentation  | --->  | OpenTelemetry SDKs   |
+-------------------+       +------------------+       +----------------------+
                                                          |
                                                          v
                                              +-----------------------+
                                              |   OTel Collector      |
                                              |  (Agent / Gateway)    |
                                              +-----------------------+
                                                |     |        |
                                         -------+     |        +---------
                                        v             v                   v
                              Prometheus      Jaeger/Tempo        Cloud Providers
                             (Metrics)        (Traces)            (GCP, AWS, Azure)
Description:
- Application: Generates telemetry via SDKs or auto-instrumentation.
- Collector: Receives data, processes it (e.g., batching for efficiency), and exports it to backends.
- Backend: Stores and analyzes data for monitoring and visualization.
- Visualization: Tools like Grafana or SigNoz display telemetry for SREs.
Integration Points with CI/CD or Cloud Tools
- CI/CD: OpenTelemetry integrates with Jenkins, GitLab, or GitHub Actions to monitor pipeline performance (e.g., build times, failure rates).
- Cloud Tools: Supports Kubernetes (via OpenTelemetry Operator), AWS, GCP, and Azure for infrastructure monitoring.
- Observability Platforms: Exports data to Prometheus, Jaeger, Grafana, or commercial tools like Datadog and New Relic.
Installation & Getting Started
Basic Setup or Prerequisites
- Requirements:
- A supported programming language (e.g., Java, Python, Go, Node.js).
- A compatible observability backend (e.g., Prometheus, Jaeger, SigNoz).
- Docker or Kubernetes for running the OpenTelemetry Collector.
- Basic knowledge of your application’s architecture.
- Dependencies: Install language-specific OpenTelemetry SDKs and the Collector binary.
- Environment: A development or production environment with network access to backends.
Hands-on: Step-by-Step Beginner-Friendly Setup Guide
This guide sets up OpenTelemetry with a Node.js application and exports telemetry to a local Jaeger instance.
- Install Node.js OpenTelemetry SDK:
npm install @opentelemetry/sdk-node @opentelemetry/auto-instrumentations-node @opentelemetry/exporter-jaeger2. Create a Tracer File (tracer.js):
const opentelemetry = require('@opentelemetry/sdk-node');
const { getNodeAutoInstrumentations } = require('@opentelemetry/auto-instrumentations-node');
const { JaegerExporter } = require('@opentelemetry/exporter-jaeger');

const sdk = new opentelemetry.NodeSDK({
  traceExporter: new JaegerExporter({ endpoint: 'http://localhost:14268/api/traces' }),
  instrumentations: [getNodeAutoInstrumentations()],
});

sdk.start();
3. Run Jaeger Locally Using Docker:
docker run -d --name jaeger \
  -e COLLECTOR_ZIPKIN_HOST_PORT=:9411 \
  -p 16686:16686 \
  -p 14268:14268 \
  -p 9411:9411 \
  jaegertracing/all-in-one:latest
4. Instrument a Sample Node.js App:
const express = require('express');
const app = express();

app.get('/', (req, res) => {
  res.send('Hello, OpenTelemetry!');
});

app.listen(3000, () => console.log('Server running on port 3000'));
5. Run the Application:
node --require './tracer.js' app.js6. Access Jaeger UI:
- Open
http://localhost:16686to view traces. - Make HTTP requests to
http://localhost:3000to generate telemetry.
7. Optional: Add OpenTelemetry Collector:
- Create a configuration file (
otel-collector-config.yaml):
receivers:
  otlp:
    protocols:
      grpc:
exporters:
  jaeger:
    endpoint: "jaeger:14268"
processors:
  batch:
service:
  pipelines:
    traces:
      receivers: [otlp]
      processors: [batch]
exporters: [jaeger]- Run the Collector:
docker run -d --name otel-collector \
  -v $(pwd)/otel-collector-config.yaml:/etc/otelcol/config.yaml \
  -p 4317:4317 \
  otel/opentelemetry-collector:latest
Real-World Use Cases
Scenario 1: Microservices Performance Monitoring
Context: An e-commerce platform uses microservices (e.g., frontend, payment, inventory). SREs need to monitor latency and errors.
- OpenTelemetry Role: Instruments services to generate traces and metrics. The Collector aggregates data and exports it to Prometheus and Grafana.
- Outcome: SREs identify a slow database query in the payment service using trace visualizations, optimizing it to reduce latency by 30%.
Scenario 2: Incident Root Cause Analysis
Context: A financial services company experiences transaction delays.
- OpenTelemetry Role: Traces track requests across services, and logs provide detailed error context. The Collector sends data to Jaeger.
- Outcome: SREs pinpoint a misconfigured API call in the transaction service, reverting changes to restore performance.
Scenario 3: Kubernetes Cluster Observability
Context: A SaaS provider runs applications on Kubernetes.
- OpenTelemetry Role: The OpenTelemetry Operator instruments pods automatically, collecting metrics and logs. Data is exported to SigNoz.
- Outcome: SREs monitor pod health, detect memory leaks, and scale resources to maintain SLOs.
Scenario 4: Cost Optimization
Context: A media streaming platform needs to optimize telemetry costs.
- OpenTelemetry Role: The Collector filters high-cardinality data and batches exports to reduce backend storage costs.
- Outcome: Reduced data ingestion costs by 20% while maintaining observability.
Benefits & Limitations
Key Advantages
- Vendor Neutrality: Works with multiple backends, avoiding lock-in.
- Unified Telemetry: Combines traces, metrics, and logs for holistic observability.
- Scalability: Handles large-scale, distributed systems effectively.
- Community Support: Backed by CNCF and major vendors, ensuring long-term viability.
- Auto-Instrumentation: Reduces manual coding effort for common frameworks.
Common Challenges or Limitations
- Complexity: Steep learning curve for teams new to observability.
- Limited Data Types: Supports only traces, metrics, and logs; other data types require additional tools.
- Performance Overhead: Instrumentation may impact application performance if not optimized.
- Log Maturity: Log support is less mature, with ongoing specification changes.
| Aspect | Advantages | Limitations |
|---|---|---|
| Vendor Neutrality | Works with any backend, no lock-in | Requires configuration for each backend |
| Data Types | Unified traces, metrics, logs | Limited to three data types |
| Scalability | Handles microservices and Kubernetes | Complex setup for large-scale deployments |
| Ease of Use | Auto-instrumentation simplifies setup | Steep learning curve for manual setups |
Best Practices & Recommendations
Security Tips
- Secure Collector: Use TLS for OTLP communication to encrypt telemetry data.
- Filter Sensitive Data: Configure processors to scrub sensitive attributes (e.g., user IDs) before export.
- Access Control: Restrict Collector endpoints to trusted networks.
Performance
- Batching: Enable batch processors to reduce export overhead.
- Sampling: Use tail-based sampling to manage high-volume traces.
- Optimize Instrumentation: Minimize spans for non-critical operations to reduce overhead.
Maintenance
- Regular Updates: Keep SDKs and Collector versions up-to-date for stability and new features.
- Monitor Collector: Track Collector health metrics to ensure reliability.
- Documentation: Maintain clear documentation of instrumentation and pipeline configurations.
Compliance Alignment
- GDPR/CCPA: Filter PII from telemetry data to comply with data privacy regulations.
- Audit Trails: Use logs to create auditable records of system events.
Automation Ideas
- CI/CD Integration: Automate instrumentation checks in CI/CD pipelines.
- Infrastructure as Code: Use Helm or Terraform to deploy the Collector in Kubernetes.
- Alerting: Configure alerts in backends (e.g., Prometheus) based on OpenTelemetry metrics.
Comparison with Alternatives
| Tool | OpenTelemetry | Prometheus | New Relic |
|---|---|---|---|
| Purpose | Observability framework for telemetry | Metrics monitoring and alerting | Full-stack observability platform |
| Data Types | Traces, metrics, logs | Metrics only | Traces, metrics, logs, events |
| Vendor Neutrality | Yes, works with any backend | Yes, open-source | Proprietary, vendor-specific |
| Instrumentation | Auto and manual, language-agnostic | Manual, pull-based | Agent-based, some auto-instrumentation |
| Ease of Setup | Moderate (complex for large setups) | Simple for metrics | Easy, but vendor lock-in |
| Scalability | High, Collector-based architecture | High, but limited to metrics | High, cloud-hosted |
| Cost | Free, open-source | Free, open-source | Subscription-based |
When to Choose OpenTelemetry
- Choose OpenTelemetry: When you need vendor-neutral, unified observability across traces, metrics, and logs, especially in cloud-native or microservices environments.
- Choose Prometheus: For metrics-focused monitoring with a pull-based model, suitable for simpler setups.
- Choose New Relic: For out-of-the-box, fully managed observability with minimal setup, but with vendor lock-in and costs.
Conclusion
OpenTelemetry is a powerful, flexible framework that empowers SREs to achieve comprehensive observability in distributed systems. Its vendor-neutral approach, support for multiple telemetry types, and integration with modern architectures make it a cornerstone of SRE practices. While it has a learning curve and some limitations, its benefits in scalability, standardization, and community support make it a future-proof choice.
Future Trends
- AI Integration: Enhanced anomaly detection using AI with telemetry data.
- Improved Log Support: Stabilization of log specifications for broader adoption.
- Serverless and Edge: Deeper integration with serverless and edge computing environments.