Introduction & Overview
Prometheus is a powerful open-source monitoring and alerting toolkit designed for reliability and scalability, widely adopted in Site Reliability Engineering (SRE) for its ability to handle dynamic, cloud-native environments. This tutorial provides an in-depth exploration of Prometheus, focusing on its application in SRE to ensure system reliability, performance, and observability. We’ll cover its core concepts, architecture, setup, real-world use cases, benefits, limitations, best practices, and comparisons with alternatives.
What is Prometheus?
Prometheus is a metrics-based monitoring system that collects, stores, and queries time-series data from various targets via HTTP endpoints. It uses a pull-based model, scraping metrics at regular intervals, and stores them in a time-series database (TSDB). Its flexible query language, PromQL, enables detailed analysis and alerting, making it a cornerstone for observability in modern infrastructures.
History or Background
- Origin: Developed by SoundCloud in 2012 to address the need for robust monitoring in dynamic environments.
- Open Source: Became open-source in 2015 and joined the Cloud Native Computing Foundation (CNCF) in 2016 as its second hosted project after Kubernetes.
- Adoption: Widely used for monitoring Kubernetes clusters, microservices, and cloud-native applications due to its scalability and integration capabilities.
- Community: Maintained by a vibrant open-source community under the Apache 2 License, with contributions from numerous organizations.
- 2012: Created at SoundCloud for monitoring microservices.
- 2015: Open-sourced.
- 2016: Joined CNCF (same foundation as Kubernetes).
- 2020+: Became the de facto standard for monitoring in Kubernetes and DevOps environments.
Why is it Relevant in Site Reliability Engineering?
- Reliability Focus: SRE emphasizes system reliability, and Prometheus provides real-time insights into system health, enabling rapid incident response.
- Scalability: Its pull-based model and TSDB are optimized for large-scale, dynamic environments like microservices and Kubernetes.
- Automation: Integrates with automation tools and CI/CD pipelines, aligning with SRE’s focus on reducing manual effort.
- Observability: Offers metrics-based observability, complementing logs and traces for a holistic view of system performance.
Core Concepts & Terminology
Key Terms and Definitions
- Time-Series Data: Metrics stored with timestamps and optional key-value pairs (labels) for multi-dimensional analysis.
- Scrape: The process of periodically collecting metrics from HTTP endpoints (default:
/metrics). - PromQL: Prometheus Query Language, used for querying and analyzing time-series data.
- Target: A source (e.g., server, application, or Kubernetes pod) from which Prometheus scrapes metrics.
- Exporter: Software that translates metrics from third-party systems (e.g., MySQL, Node.js) into Prometheus-compatible formats.
- Pushgateway: A component for short-lived jobs to push metrics to Prometheus, complementing the pull-based model.
- Alertmanager: Manages alerts by grouping, deduplicating, and routing them to notification channels (e.g., Slack, email).
- TSDB: Time-Series Database, optimized for high-performance storage and retrieval of metrics.
| Term | Definition | Example |
|---|---|---|
| Metric | A numerical measurement collected over time. | CPU usage, request latency, memory usage. |
| Time-series | Data points indexed over time, stored by Prometheus. | http_requests_total{method="GET",status="200"} |
| Label | Key-value pairs that add dimensions to metrics. | instance="app1", region="us-east" |
| PromQL | Query language for extracting, filtering, and aggregating metrics. | rate(http_requests_total[5m]) |
| Scraping | Prometheus pulls metrics by hitting endpoints (/metrics). | http://localhost:9090/metrics |
| Exporter | Small agents that expose metrics from apps or systems. | Node Exporter, MySQL Exporter. |
| Alertmanager | Handles alerts sent by Prometheus, routes them to channels. | Slack, Email, PagerDuty. |
| Pushgateway | Collects metrics that cannot be scraped directly (batch jobs). | CI/CD job execution time. |
How It Fits into the Site Reliability Engineering Lifecycle
| SRE Lifecycle Phase | Prometheus Role |
|---|---|
| Monitoring | Collects metrics to monitor system health, resource usage, and application performance. |
| Incident Response | Triggers alerts via Alertmanager for rapid issue detection and resolution. |
| Post-Incident Analysis | Provides historical metrics for root cause analysis and post-incident reviews. |
| Capacity Planning | Analyzes trends in metrics to forecast resource needs and optimize infrastructure. |
| Automation | Integrates with CI/CD pipelines and automation tools for proactive monitoring. |
Prometheus aligns with SRE principles by enabling data-driven decisions, reducing toil through automation, and fostering a culture of observability.
Architecture & How It Works
Components
Prometheus’s architecture is modular, designed for scalability and reliability. The core components include:
- Prometheus Server: Scrapes metrics, stores them in the TSDB, and processes PromQL queries.
- Exporters: Translate metrics from third-party systems into Prometheus format (e.g., Node Exporter for system metrics, MySQL Exporter for database metrics).
- Pushgateway: Handles metrics from short-lived or batch jobs that cannot be scraped directly.
- Alertmanager: Processes alerts, groups them, and sends notifications to external systems (e.g., PagerDuty, Slack).
- Service Discovery: Automatically discovers targets in dynamic environments like Kubernetes or cloud platforms.
- TSDB: Stores time-series data efficiently, supporting size- or time-based retention policies.
- HTTP Server: Provides an interface for querying metrics and visualizing data via PromQL.
Internal Workflow
- Discovery: Prometheus uses service discovery or static configurations to identify targets.
- Scraping: The server periodically pulls metrics from target HTTP endpoints (e.g.,
/metrics). - Storage: Metrics are stored in the TSDB with timestamps and labels.
- Querying: Users query data using PromQL through the HTTP server or visualization tools like Grafana.
- Alerting: Rules evaluate metrics, triggering alerts sent to Alertmanager for processing and notification.
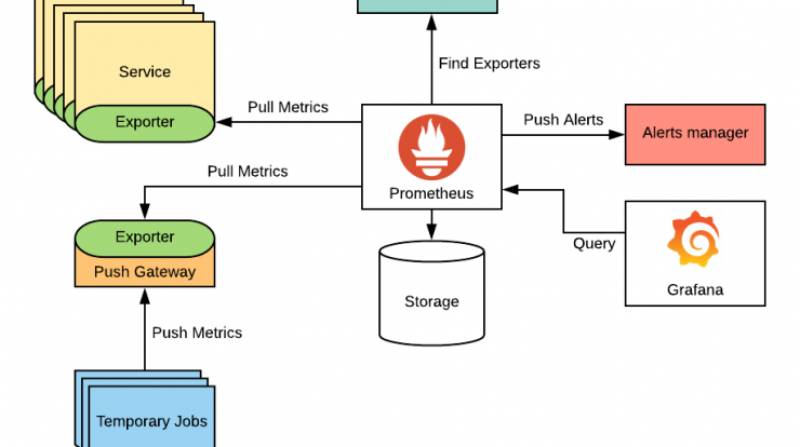
Architecture Diagram Description
The Prometheus architecture can be visualized as follows:
- Prometheus Server: Central component, connected to all other elements.
- Targets/Exporters: Feed metrics to the server via HTTP endpoints.
- Pushgateway: Receives metrics from short-lived jobs and exposes them to the server.
- Alertmanager: Receives alerts from the server and routes notifications.
- Visualization Tools (e.g., Grafana): Query the server for dashboards.
- TSDB: Stores metrics locally, with optional remote storage for scalability.
- Service Discovery: Dynamically identifies targets in cloud or container environments.
          +-----------------+        +------------------+
          |   Applications  |        |   Databases      |
          | (Node, Nginx,   |        | (MySQL, MongoDB) |
          +-----------------+        +------------------+
                   |                          |
                   v                          v
            +--------------+           +--------------+
            | Exporters    |           | Exporters    |
            +--------------+           +--------------+
                   \                    /
                    \                  /
                     v                v
                 +-------------------------+
                 |     Prometheus Server   |
                 | (Scrape, Store, Query) |
                 +-------------------------+
                     |    ^        |
                     |    |        v
                     |    |   +------------+
                     |    |   | Alertmanager|
                     |    |   +------------+
                     v    |
            +--------------------+
            | Visualization (UI, |
            | Grafana, PromQL)   |
            +--------------------+
Integration Points with CI/CD or Cloud Tools
- CI/CD: Integrates with Jenkins, GitLab CI, or GitHub Actions to monitor pipeline performance and trigger alerts on failures.
- Cloud Platforms: Supports AWS, GCP, and Azure via service discovery (e.g., EC2, GCE) and cloud-specific exporters.
- Kubernetes: Natively discovers pods and services, with Helm charts for easy deployment (e.g.,
kube-prometheus-stack). - Grafana: Visualizes Prometheus metrics for dashboards and observability.
Installation & Getting Started
Basic Setup or Prerequisites
- OS: Linux, macOS, or Windows.
- Dependencies: Go (for building from source) and Node.js (for UI assets, optional).
- Hardware: Minimum 2GB RAM, 10GB disk space for small setups.
- Network: Access to target HTTP endpoints (default port: 9090 for Prometheus, 9100 for Node Exporter).
- Configuration: Basic knowledge of YAML for
prometheus.yml.
Hands-on: Step-by-Step Beginner-Friendly Setup Guide
This guide sets up Prometheus and Node Exporter on a Linux system.
- Download Prometheus:
wget https://github.com/prometheus/prometheus/releases/download/v2.53.0/prometheus-2.53.0.linux-amd64.tar.gz
tar xvfz prometheus-*.tar.gz
cd prometheus-2.53.0.linux-amd64
2. Configure Prometheus:
Edit prometheus.yml to add a scrape target (e.g., Node Exporter):
global:
  scrape_interval: 15s
scrape_configs:
  - job_name: 'node'
    static_configs:
      - targets: ['localhost:9100']
3. Run Prometheus:
./prometheus --config.file=prometheus.ymlAccess the Prometheus UI at http://localhost:9090.
4. Install Node Exporter:
wget https://github.com/prometheus/node_exporter/releases/download/v1.8.2/node_exporter-1.8.2.linux-amd64.tar.gz
tar xvfz node_exporter-*.tar.gz
cd node_exporter-1.8.2.linux-amd64
./node_exporter
Node Exporter exposes system metrics at http://localhost:9100/metrics.
5. Verify Metrics:
- Visit
http://localhost:9090/targetsto confirm the Node Exporter target is “UP.” - Query metrics in the Prometheus UI (e.g.,
node_cpu_seconds_total).
6. Optional: Install Grafana:
sudo apt-get install -y grafana
sudo systemctl start grafana-server
Add Prometheus as a data source in Grafana (http://localhost:3000) and create dashboards.
Note: For Kubernetes, use helm install prometheus prometheus-community/kube-prometheus-stack --namespace monitoring.
Real-World Use Cases
Scenario 1: Kubernetes Cluster Monitoring
- Context: An SRE team manages a Kubernetes cluster hosting microservices.
- Application: Prometheus auto-discovers pods and scrapes metrics (e.g., CPU, memory, pod health) using
kube-prometheus-stack. Alerts are set for high pod failure rates. - Outcome: Rapid detection of pod crashes, enabling automated scaling or manual intervention.
Scenario 2: Application Performance Monitoring
- Context: A fintech company monitors API latency and error rates.
- Application: Prometheus scrapes custom metrics from application endpoints (e.g.,
/metrics) using client libraries (e.g., Python, Go). Alerts trigger on latency > 500ms. - Outcome: Identifies slow APIs, improving user experience and transaction reliability.
Scenario 3: Infrastructure Monitoring
- Context: A cloud provider monitors server health across multiple data centers.
- Application: Node Exporter collects system metrics (e.g., CPU, disk I/O). Thanos or Mimir aggregates metrics for a single-pane-of-glass view.
- Outcome: Detects resource bottlenecks, aiding capacity planning.
Scenario 4: Batch Job Monitoring
- Context: A data analytics firm runs nightly batch jobs.
- Application: Jobs push metrics to Pushgateway, which Prometheus scrapes. Alerts notify on job failures.
- Outcome: Ensures timely job completion, reducing data pipeline delays.
Benefits & Limitations
Key Advantages
- Scalability: Handles millions of metrics per second, ideal for large-scale systems.
- Flexibility: Multi-dimensional data model with PromQL supports complex queries.
- Community Support: Extensive ecosystem with exporters and integrations (e.g., Grafana, Kubernetes).
- Reliability: Independent servers ensure monitoring during outages.
Common Challenges or Limitations
- High Cardinality: Struggles with metrics having many unique label combinations, impacting performance.
- Log Management: Not designed for logs; requires tools like Loki or ELK.
- Long-Term Storage: Local TSDB is limited; requires remote storage (e.g., Thanos, Mimir) for scalability.
- Learning Curve: PromQL and configuration can be complex for beginners.
Best Practices & Recommendations
Security Tips
- Network Security: Restrict access to Prometheus endpoints using firewalls or VPCs.
- Authentication: Use reverse proxies (e.g., Nginx) with basic auth for the Prometheus UI.
- Encryption: Enable HTTPS for scrape endpoints and Alertmanager notifications.
Performance
- Optimize Scraping: Set appropriate scrape intervals (e.g., 15s for critical systems, 60s for less critical).
- Recording Rules: Pre-aggregate high-cardinality metrics to reduce query load.
- Sharding: Use multiple Prometheus instances for large-scale setups, federated with Thanos or Mimir.
Maintenance
- Retention Policies: Configure time- or size-based retention to manage TSDB growth.
- Backup: Use remote storage for long-term data retention and disaster recovery.
- High Availability: Deploy multiple Prometheus instances for redundancy.
Compliance Alignment
- Auditing: Derive metrics from immutable logs for compliance (e.g., error counts).
- Data Retention: Align retention policies with regulatory requirements (e.g., GDPR, HIPAA).
Automation Ideas
- CI/CD Integration: Automate Prometheus configuration updates via GitOps (e.g., ArgoCD).
- Alert Automation: Use Alertmanager to trigger automated remediation scripts (e.g., auto-scaling).
Comparison with Alternatives
| Feature | Prometheus | Nagios | Zabbix | New Relic |
|---|---|---|---|---|
| Data Model | Time-series, multi-dimensional | Event-based | Time-series | Time-series, event-based |
| Collection Model | Pull-based | Push-based | Push/pull hybrid | Agent-based (push) |
| Query Language | PromQL (powerful, flexible) | Limited | SQL-like | NRQL |
| Scalability | High (with federation) | Limited | Moderate | High (cloud-hosted) |
| Open Source | Yes (Apache 2) | Yes (GPL) | Yes (GPL) | No (proprietary) |
| Cloud-Native Support | Excellent (Kubernetes, microservices) | Poor | Moderate | Good |
| Cost | Free | Free | Free | Subscription-based |
When to Choose Prometheus
- Dynamic Environments: Ideal for Kubernetes, microservices, and cloud-native setups due to service discovery and pull-based model.
- Metrics Focus: Best for numerical time-series data, not logs or traces.
- Open-Source Preference: Suits organizations seeking vendor-neutral, community-driven solutions.
- Custom Monitoring: Use client libraries for custom application metrics.
Choose Nagios or Zabbix for legacy systems or push-based monitoring, and New Relic for managed solutions with broader observability (logs, traces, metrics).
Conclusion
Prometheus is a cornerstone of SRE, offering robust metrics-based monitoring for dynamic, scalable systems. Its pull-based model, PromQL, and integration with tools like Grafana and Kubernetes make it indispensable for ensuring reliability and observability. While it excels in metrics collection, it requires complementary tools for logs and long-term storage. Future trends include tighter integration with observability platforms (e.g., OpenObserve, SigNoz) and enhanced AI-driven anomaly detection.,
Next Steps
- Explore Prometheus with a small setup and experiment with PromQL queries.
- Integrate with Grafana for advanced visualizations.
- Join the Prometheus community on GitHub or CNCF Slack for support.
Resources
- Official Documentation: https://prometheus.io/docs/introduction/overview/
- GitHub: https://github.com/prometheus/prometheus
- CNCF Slack: https://slack.cncf.io/ (Prometheus channel)