Introduction & Overview
Health checks are a fundamental practice in Site Reliability Engineering (SRE) to ensure systems remain reliable, available, and performant. They involve periodic or on-demand assessments of system components to verify their operational status, detect failures, and trigger recovery actions. By integrating health checks into monitoring and incident response workflows, SRE teams can proactively maintain system health, minimize downtime, and enhance user experience.
What are Health Checks?
Health checks are automated or manual processes that verify whether a system, service, or component is functioning as expected. They typically involve querying a service’s health check endpoint (e.g., /health) to retrieve status information, such as availability, performance, or resource usage. In SRE, health checks are critical for maintaining service reliability in distributed systems, microservices architectures, and cloud-native environments.
History or Background
The concept of health checks emerged with the rise of distributed systems and microservices, where individual components need to report their status to ensure overall system reliability. Early implementations were simple “ping” tests, but modern health checks, influenced by SRE practices pioneered by Google, incorporate comprehensive diagnostics, including database connectivity, memory usage, and dependency status. The adoption of containerization (e.g., Docker, Kubernetes) and cloud platforms has further standardized health checks as a core reliability practice.
Why is it Relevant in Site Reliability Engineering?
Health checks are vital in SRE for several reasons:
- Proactive Issue Detection: Identify issues before they impact users.
- Automated Recovery: Trigger failover, restarts, or resource reallocation.
- Scalability: Ensure systems handle load and failures gracefully in distributed environments.
- Alignment with SLOs: Support Service Level Objectives (SLOs) by maintaining system uptime and performance.
- Incident Management: Provide data for root cause analysis and postmortems.
Core Concepts & Terminology
Key Terms and Definitions
| Term | Definition |
|---|---|
| Health Check | A mechanism to assess the operational status of a system or service, often via an API endpoint (e.g., /health). |
| Liveness Probe | A check to determine if a service is running and responsive (e.g., in Kubernetes). |
| Readiness Probe | A check to verify if a service is ready to handle requests (e.g., after initialization). |
| Golden Signals | Key metrics (latency, traffic, errors, saturation) used to evaluate system health. |
| Service Level Indicator (SLI) | A measurable metric (e.g., uptime, error rate) tied to health checks to evaluate service performance. |
| Service Level Objective (SLO) | A target value for an SLI, defining acceptable performance levels. |
| Observability | The ability to understand system behavior through logs, metrics, and traces, often informed by health checks. |
How Health Checks Fit into the SRE Lifecycle
Health checks are integrated across the SRE lifecycle:
- Design Phase: Define health check requirements for new services, including SLIs and SLOs.
- Development: Implement health check endpoints in application code.
- Deployment: Configure health checks in CI/CD pipelines and cloud platforms.
- Monitoring: Use health checks to collect metrics and trigger alerts.
- Incident Response: Leverage health check data for diagnostics and recovery.
- Postmortems: Analyze health check failures to improve system resilience.
Architecture & How It Works
Components
Health checks in SRE typically involve:
- Health Check Endpoint: An API (e.g., HTTP
/health) returning status (e.g.,200 OKfor healthy,503 Service Unavailablefor unhealthy). - Probing Client: A monitoring service, load balancer, or orchestrator (e.g., Kubernetes) that queries the endpoint.
- Metrics Collection: Tools like Prometheus or Datadog to collect and store health check data.
- Alerting System: Notifies engineers when health checks fail (e.g., PagerDuty).
- Recovery Mechanisms: Automated actions like restarting services or rerouting traffic.
Internal Workflow
- Probe Initiation: A probing client sends a request to the service’s health check endpoint.
- Status Evaluation: The service performs internal checks (e.g., database connectivity, memory usage).
- Response: The endpoint returns a status code and optional diagnostic data (e.g., JSON payload).
- Action: The probing client processes the response, triggering alerts or recovery actions if needed.
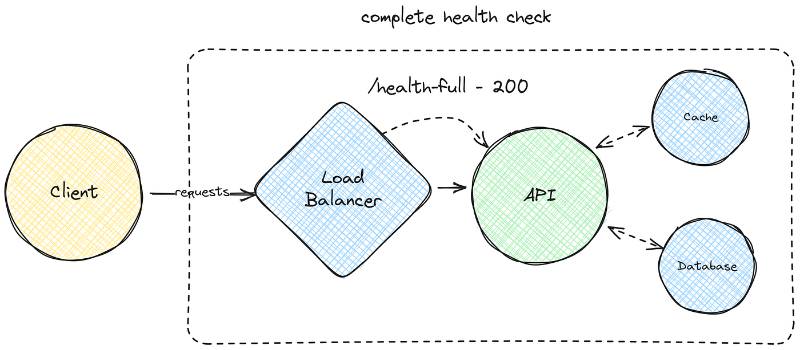
Architecture Diagram Description
The architecture diagram for health checks in an SRE context includes:
- Application Service: Hosts the
/healthendpoint, performing internal diagnostics. - Load Balancer: Queries the endpoint to route traffic only to healthy instances.
- Monitoring System: Collects metrics and logs from health checks (e.g., Prometheus, Grafana).
- Alerting System: Sends notifications based on health check failures.
- Orchestrator: Manages container health (e.g., Kubernetes liveness/readiness probes).
- External Dependencies: Databases or APIs checked by the service.
[ Client/User ]
      |
      v
[ Load Balancer / Ingress ] ----> Routes only to healthy services
      |
      v
[ Service / Application ]
      |       \
      |        --> /health (endpoint for liveness/readiness)
      v
[ Health Check Agent / Monitoring Tool ]
      |
      v
[ Metrics Collector (Prometheus, Datadog) ]
      |
      v
[ Alerting System (PagerDuty, Email, Slack) ]
Diagram Layout:
- A central box represents the application service with a
/healthendpoint. - Arrows from the load balancer and orchestrator to the endpoint indicate probing.
- Metrics flow from the service to the monitoring system.
- Alerts flow from the monitoring system to the alerting system.
- External dependencies (e.g., database) are connected to the service.
Integration Points with CI/CD or Cloud Tools
- CI/CD: Health checks are validated during deployment to ensure new releases are healthy (e.g., in Jenkins or GitHub Actions).
- Cloud Platforms: AWS ELB, Google Cloud Load Balancing, and Azure Load Balancer use health checks to manage traffic.
- Orchestrators: Kubernetes uses liveness and readiness probes to manage container lifecycles.
- Monitoring Tools: Prometheus scrapes health check endpoints, Grafana visualizes metrics.
Installation & Getting Started
Basic Setup or Prerequisites
- Programming Language: A language like Python, Java, or Node.js for implementing health check endpoints.
- Monitoring Tools: Prometheus, Grafana, or Datadog for metrics collection.
- Container Orchestrator: Kubernetes or Docker for containerized environments.
- Cloud Provider: AWS, GCP, or Azure for load balancing and health check integration.
- Dependencies: Ensure external services (e.g., databases) are accessible.
Hands-On: Step-by-Step Beginner-Friendly Setup Guide
Below is a guide to set up a basic health check endpoint in a Node.js application with Express, integrated with Prometheus and Kubernetes.
Step 1 – Create a simple app
const express = require("express");
const app = express();

// Liveness check
app.get("/health", (req, res) => res.status(200).send("OK"));

// Readiness check
app.get("/ready", (req, res) => {
  const dbConnected = true; // simulate DB check
  if (dbConnected) res.status(200).send("READY");
  else res.status(500).send("NOT READY");
});

app.listen(3000, () => console.log("App running on port 3000"));
Step 2 – Dockerize it
FROM node:16
WORKDIR /app
COPY . .
RUN npm install
CMD ["node", "app.js"]
Step 3 – Kubernetes Health Checks
livenessProbe:
  httpGet:
    path: /health
    port: 3000
  initialDelaySeconds: 5
  periodSeconds: 10

readinessProbe:
  httpGet:
    path: /ready
    port: 3000
  initialDelaySeconds: 5
  periodSeconds: 10
Step 4 – Verify
Deploy and observe pod status with:
kubectl get pods
kubectl describe pod <pod-name>
Real-World Use Cases
Scenario 1: E-Commerce Platform
An e-commerce platform uses health checks to ensure its payment service is operational during peak shopping seasons. The /health endpoint verifies database connectivity, API latency, and payment gateway status. Kubernetes liveness probes restart unhealthy containers, while the load balancer routes traffic away from failed instances, ensuring seamless transactions.
Scenario 2: Streaming Service
A video streaming service implements health checks to monitor its content delivery network (CDN) and encoding services. Health checks validate buffer capacity and stream latency. Alerts are triggered if latency exceeds SLOs, prompting SREs to scale resources or investigate bottlenecks, as seen in Netflix’s microservices migration.
Scenario 3: Healthcare Application
A telemedicine platform uses health checks to ensure compliance with HIPAA regulations. The /health endpoint checks encryption status and patient data access controls. Failure alerts trigger immediate incident response to prevent data breaches, aligning with industry-specific security requirements.
Scenario 4: Ride-Sharing Platform
A ride-sharing app like Uber uses health checks in its event-driven architecture to monitor driver-matching and billing services. Health checks verify event queue status and database replication, ensuring real-time ride processing during high-demand periods.
Benefits & Limitations
Key Advantages
- Proactive Monitoring: Detects issues before they impact users.
- Automation: Enables automated recovery, reducing manual intervention.
- Scalability: Supports dynamic scaling in cloud environments.
- Improved SLOs: Ensures services meet reliability and performance targets.
Common Challenges or Limitations
- False Positives/Negatives: Inaccurate health checks may trigger unnecessary alerts or miss issues.
- Overhead: Comprehensive checks can consume resources, impacting performance.
- Complexity: Managing health checks in distributed systems requires careful design.
- Incomplete Coverage: Health checks may not cover all failure modes (e.g., intermittent issues).
Best Practices & Recommendations
Security Tips
- Restrict health check endpoints to internal networks or authenticated clients.
- Avoid exposing sensitive data in health check responses.
- Regularly rotate credentials used in health checks.
Performance
- Optimize health check frequency to balance monitoring and resource usage.
- Use lightweight checks (e.g., simple HTTP status) for high-frequency probes.
- Cache results for external dependency checks to reduce latency.
Maintenance
- Regularly update health check logic to reflect system changes.
- Monitor health check metrics to identify trends and recurring issues.
- Document health check configurations and failure scenarios.
Compliance Alignment
- Ensure health checks verify compliance with regulations (e.g., HIPAA, GDPR).
- Include audit logs in health check responses for traceability.
Automation Ideas
- Integrate health checks with CI/CD to validate deployments.
- Use chaos engineering (e.g., Netflix’s Chaos Monkey) to test health check reliability.
- Automate alert suppression during maintenance windows.
Comparison with Alternatives
| Feature | Health Checks | Heartbeat Monitoring | Synthetic Monitoring |
|---|---|---|---|
| Purpose | Verify service/component status | Periodic signals to confirm system is alive | Simulate user interactions |
| Scope | Internal system health | Basic system availability | End-to-end user experience |
| Complexity | Moderate | Low | High |
| Use Case | Microservices, cloud systems | Simple servers | Web applications, APIs |
| Tools | Prometheus, Kubernetes probes | Nagios, Pingdom | Selenium, Datadog Synthetic |
| Pros | Detailed diagnostics, automated recovery | Simple, low overhead | Realistic user perspective |
| Cons | Can be resource-intensive | Limited diagnostics | Complex setup, costly |
When to Choose Health Checks
- Use health checks for distributed systems requiring detailed diagnostics (e.g., microservices).
- Choose heartbeat monitoring for simple systems needing basic availability checks.
- Opt for synthetic monitoring when validating end-to-end user experiences is critical.
Conclusion
Health checks are a cornerstone of SRE, enabling proactive monitoring, automated recovery, and alignment with SLOs. By integrating health checks into system design, deployment, and monitoring workflows, SRE teams can build resilient, scalable systems. As systems grow more complex with microservices and cloud adoption, health checks will evolve with AI-driven diagnostics and increased automation.
Next Steps
- Experiment with health checks in a sandbox environment using Kubernetes or Docker.
- Explore advanced monitoring with tools like Prometheus and Grafana.
- Join SRE communities for best practices and updates.
Resources
- Official Kubernetes Documentation: https://kubernetes.io/docs/tasks/configure-pod-container/configure-liveness-readiness-startup-probes/
- Google SRE Book: https://sre.google/sre-book/[](https://sre.google/books/)
- Prometheus Documentation: https://prometheus.io/docs/
- Microservices.io Health Check Pattern: https://microservices.io/patterns/observability/health-check-api.html