Introduction & Overview
What is Logging?
Logging in the context of Site Reliability Engineering (SRE) is the process of recording events, metrics, and system activities in a structured format to monitor, troubleshoot, and maintain systems. Logs capture critical details about system performance, errors, user activities, and operational states, enabling engineers to analyze and ensure system reliability. Logs are a key pillar of observability, alongside metrics and tracing, providing a historical record of system behavior.
History or Background
Logging has evolved significantly over time:
- Early Days (1980s–1990s): Logging began with simple text-based files, such as syslog in UNIX systems, where logs were stored locally on servers.
- 2000s: The rise of distributed systems led to centralized logging solutions like Splunk and the ELK Stack (Elasticsearch, Logstash, Kibana) to manage logs from multiple sources.
- Modern Era (2010s–Present): Cloud-native logging emerged with tools like Fluentd, Grafana Loki, and cloud provider solutions (e.g., AWS CloudWatch, Google Cloud Logging). The shift to microservices and containerized environments made logging critical for observability.
Why is it Relevant in Site Reliability Engineering?
Logging is a cornerstone of SRE because it enables:
- Incident Response: Logs help identify the root cause of failures by providing detailed event timelines.
- System Monitoring: Logs track system health, performance, and anomalies in real-time.
- Audit and Compliance: Logs provide an auditable trail for regulatory requirements (e.g., GDPR, HIPAA).
- Proactive Maintenance: Logs help detect issues before they escalate, reducing downtime.
By supporting SRE principles like reducing toil, improving reliability, and enabling data-driven decisions, logging ensures systems meet service-level objectives (SLOs).
Core Concepts & Terminology
Key Terms and Definitions
- Log Entry: A single record of an event, typically including a timestamp, message, severity level, and metadata (e.g., source, user ID).
- Log Aggregation: The process of collecting logs from multiple sources (e.g., servers, containers) into a centralized system for analysis.
- Structured Logging: Logs formatted in a machine-readable format, such as JSON, for easier querying and analysis.
- Log Levels: Severity indicators for logs, such as DEBUG (development), INFO (general information), WARN (potential issues), ERROR (failures), and FATAL (critical system failures).
- Log Retention: Policies defining how long logs are stored, balancing storage costs with compliance needs.
- Observability: The ability to understand a system’s internal state using logs, metrics, and traces.
- Log Forwarder: Tools or agents (e.g., Fluentd, Logstash) that collect and send logs to a central storage system.
| Term | Definition | Example |
|---|---|---|
| Log Event | A single entry in the log file | 2025-08-20 12:00:01 ERROR Database connection failed |
| Log Level | Severity classification of log | DEBUG, INFO, WARN, ERROR, FATAL |
| Log Rotation | Automatic archiving of logs after size/time | Linux logrotate |
| Centralized Logging | Collecting logs from multiple sources into one place | ELK Stack |
| Structured Logs | Logs with a defined schema (JSON, key-value pairs) | { "time": "2025-08-20", "status": "ERROR", "service": "auth" } |
| Observability | Monitoring system state using logs, metrics, traces | Used in modern SRE toolchains |
How It Fits into the SRE Lifecycle
Logging supports various stages of the SRE lifecycle:
- Design: Define logging requirements to ensure observability for new services.
- Deployment: Integrate logging into CI/CD pipelines to capture deployment events.
- Operations: Use logs for real-time monitoring, alerting, and performance analysis.
- Incident Management: Analyze logs to diagnose issues and perform root cause analysis (RCA).
- Postmortem: Document incidents using logs to identify patterns and prevent recurrence.
Architecture & How It Works
Components and Internal Workflow
A typical logging architecture consists of the following components:
- Log Generators: Applications, services, containers, or infrastructure components (e.g., Kubernetes pods, databases) that produce logs.
- Log Collectors/Forwarders: Agents like Fluentd, Logstash, or Fluent Bit that collect logs from generators and forward them to storage.
- Log Storage: Centralized systems like Elasticsearch, AWS CloudWatch, or Grafana Loki that store logs for querying and analysis.
- Log Analysis Tools: Dashboards and visualization tools (e.g., Kibana, Grafana) that enable querying, filtering, and visualizing logs.
- Alerting Systems: Tools like PagerDuty or Opsgenie that use log data to trigger alerts based on predefined conditions.
Workflow:
- Applications or systems generate logs (e.g., application errors, HTTP requests).
- Log collectors gather logs from multiple sources, often parsing and formatting them.
- Logs are forwarded to a centralized storage system, where they are indexed.
- SREs query logs using analysis tools to monitor systems or troubleshoot issues.
- Alerts are triggered if logs indicate anomalies or critical events.
Architecture Diagram
Below is a textual description of a typical logging architecture (as images cannot be generated directly):
[ Applications / Services / OS / Containers ]
                     │
                [ Log Agents ]
                     │
          ┌──────────┴──────────┐
          │ Log Aggregator (e.g. ELK) │
          └──────────┬──────────┘
                     │
   ┌────────────┬─────────────┐
   │   Storage  │ Visualization│
   │ (S3, DB)   │ (Kibana, Grafana)│
   └────────────┴─────────────┘
                     │
             [ Alerts / Incidents ]
- Applications/Services: Microservices, containers, or servers generating logs.
- Log Collectors: Deployed as sidecar containers or agents on hosts.
- Centralized Storage: Scalable storage for logs, often with indexing for fast querying.
- Analysis Tools: Dashboards for visualizing log data and trends.
- Alerting Systems: Integrated with storage to send notifications based on log patterns.
Integration Points with CI/CD or Cloud Tools
- CI/CD Pipelines: Logs from build and deployment processes (e.g., Jenkins, GitLab CI) are captured to track pipeline health.
- Cloud Tools: Cloud provider logging services (e.g., AWS CloudWatch, Google Cloud Logging) integrate with compute services (EC2, GKE) for seamless log collection.
- Container Orchestration: Kubernetes integrates with logging tools like Fluentd to collect container logs.
- Monitoring Systems: Logs feed into monitoring tools like Prometheus for correlation with metrics.
Installation & Getting Started
Basic Setup or Prerequisites
To set up a logging system for SRE, you’ll need:
- A logging tool (e.g., ELK Stack, Fluentd + Grafana Loki).
- A server or cloud environment (e.g., AWS, GCP, or Kubernetes cluster).
- Administrative access to configure agents and storage.
- Basic knowledge of JSON, YAML, and command-line tools.
- Network connectivity between log sources and storage.
Hands-on: Step-by-Step Beginner-Friendly Setup Guide
This guide sets up a basic ELK Stack (Elasticsearch, Logstash, Kibana) on a single Ubuntu 20.04 server.
Step 1: Install Elasticsearch
# Install Java (required for Elasticsearch)
sudo apt update
sudo apt install openjdk-11-jre-headless -y

# Add Elasticsearch repository
wget -qO - https://artifacts.elastic.co/GPG-KEY-elasticsearch | sudo apt-key add -
echo "deb https://artifacts.elastic.co/packages/7.x/apt stable main" | sudo tee /etc/apt/sources.list.d/elastic-7.x.list
sudo apt update

# Install and start Elasticsearch
sudo apt install elasticsearch -y
sudo systemctl enable elasticsearch
sudo systemctl start elasticsearch
Step 2: Install Logstash
# Install Logstash
sudo apt install logstash -y

# Create a basic Logstash configuration
sudo nano /etc/logstash/conf.d/logstash.conf
Add the following to logstash.conf:
input {
  file {
    path => "/var/log/*.log"
    start_position => "beginning"
  }
}
output {
  elasticsearch {
    hosts => ["localhost:9200"]
    index => "logs-%{+YYYY.MM.dd}"
  }
}
# Start Logstash
sudo systemctl enable logstash
sudo systemctl start logstashStep 3: Install Kibana
# Install Kibana
sudo apt install kibana -y
sudo systemctl enable kibana
sudo systemctl start kibana
Step 4: Access Kibana
- Open a browser and navigate to
http://<server-ip>:5601. - Create an index pattern (e.g.,
logs-*) to view logs. - Use Kibana’s dashboard to query and visualize logs.
Step 5: Generate Sample Logs
# Create a sample log file
echo "2025-08-27T10:00:00Z ERROR Sample error occurred" | sudo tee -a /var/log/sample.log- Verify logs appear in Kibana under the
logs-*index.
Real-World Use Cases
Scenario 1: Incident Response in a Microservices Architecture
- Context: A payment processing microservice fails intermittently.
- Application: SREs use logs from AWS CloudWatch to trace HTTP 500 errors, identifying a database connection timeout. Structured logs reveal the specific service and endpoint causing the issue.
- Outcome: The team increases the database connection pool size, resolving the issue.
Scenario 2: Compliance Auditing in Healthcare
- Context: A healthcare application must comply with HIPAA regulations.
- Application: Logs from application access and data queries are stored in Google Cloud Logging with a 7-year retention policy. SREs use logs to audit unauthorized access attempts.
- Outcome: The audit trail ensures compliance and identifies a misconfigured API exposing sensitive data.
Scenario 3: Performance Monitoring in E-Commerce
- Context: An e-commerce platform experiences slow page loads during peak traffic.
- Application: Logs from Fluentd and Grafana Loki show increased latency in a third-party payment API. SREs correlate logs with metrics to confirm the bottleneck.
- Outcome: The team implements caching to reduce API calls, improving performance.
Scenario 4: Security Incident Detection
- Context: A financial application detects suspicious login attempts.
- Application: Logs in Splunk reveal multiple failed login attempts from a single IP. SREs set up alerts for brute-force patterns.
- Outcome: The IP is blocked, and multifactor authentication is enforced.
Benefits & Limitations
Key Advantages
- Enhanced Observability: Logs provide detailed insights into system behavior.
- Troubleshooting: Pinpoint issues quickly with detailed event data.
- Compliance: Supports audit requirements for industries like finance and healthcare.
- Scalability: Modern logging systems handle large-scale, distributed environments.
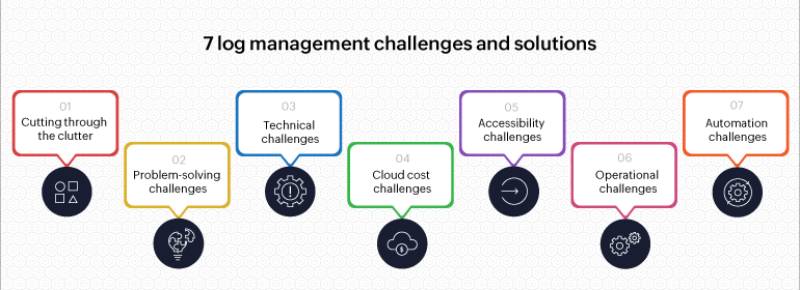
Common Challenges or Limitations
- Storage Costs: Large log volumes increase storage expenses.
- Complexity: Managing logs in distributed systems requires sophisticated tools.
- Noise: Excessive or unstructured logs can obscure critical information.
- Latency: Real-time log processing may introduce delays in high-traffic systems.
| Aspect | Benefit | Limitation |
|---|---|---|
| Scalability | Handles large-scale systems | High storage and processing costs |
| Troubleshooting | Detailed event data for RCA | Unstructured logs can be hard to parse |
| Compliance | Auditable trails for regulations | Requires careful retention policies |
| Real-Time Analysis | Enables proactive monitoring | Potential latency in high-traffic systems |
Best Practices & Recommendations
Security Tips
- Encrypt logs in transit and at rest to protect sensitive data.
- Restrict access to logs using role-based access control (RBAC).
- Mask or redact sensitive information (e.g., PII) before logging.
Performance
- Use structured logging (e.g., JSON) for easier parsing and querying.
- Implement log sampling to reduce volume in high-traffic systems.
- Optimize log storage with indexing and compression.
Maintenance
- Define clear log retention policies (e.g., 30 days for debugging, 7 years for compliance).
- Regularly review log configurations to eliminate redundant or noisy logs.
- Automate log rotation to prevent disk space issues.
Compliance Alignment
- Align log retention with regulations (e.g., GDPR, HIPAA).
- Use audit logs to track access and changes to critical systems.
- Implement tamper-proof logging for forensic analysis.
Automation Ideas
- Integrate logging with CI/CD pipelines to capture build and deployment logs.
- Set up automated alerts for critical log patterns (e.g., ERROR logs).
- Use log analysis tools to generate automated reports for SLO tracking.
Comparison with Alternatives
| Tool/Approach | Strengths | Weaknesses | When to Choose |
|---|---|---|---|
| ELK Stack | Open-source, flexible, scalable | Complex setup, high resource usage | Large-scale, customizable logging |
| Grafana Loki | Lightweight, cost-efficient | Limited querying capabilities | Cloud-native, Kubernetes environments |
| AWS CloudWatch | Fully managed, integrates with AWS | Vendor lock-in, costly at scale | AWS-based infrastructure |
| Splunk | Powerful analytics, enterprise-grade | Expensive, steep learning curve | Compliance-heavy industries |
When to Choose Logging Over Alternatives:
- Choose logging over metrics for detailed event tracking and debugging.
- Use logging instead of tracing for broad system monitoring rather than request-specific flows.
- Opt for centralized logging in distributed systems to consolidate data from multiple sources.
Conclusion
Final Thoughts
Logging is a critical component of SRE, enabling observability, incident response, and compliance. By implementing robust logging systems, SREs can ensure system reliability, reduce downtime, and meet regulatory requirements. Modern tools like ELK Stack, Grafana Loki, and cloud-native solutions make logging scalable and efficient.
Future Trends
- AI-Powered Log Analysis: Machine learning to detect anomalies and predict failures.
- Serverless Logging: Integration with serverless architectures for cost efficiency.
- Unified Observability: Combining logs, metrics, and traces for holistic monitoring.
Next Steps
- Experiment with tools like ELK Stack or Grafana Loki in a sandbox environment.
- Integrate logging with existing monitoring and alerting systems.
- Explore advanced features like structured logging and real-time alerting.
Resources
- Official ELK Stack Documentation: https://www.elastic.co/guide/index.html
- Grafana Loki Documentation: https://grafana.com/docs/loki/latest/
- AWS CloudWatch Documentation: https://docs.aws.amazon.com/cloudwatch/
- SRE Community: https://sre.google/community/