Introduction & Overview
Observability is a critical pillar in Site Reliability Engineering (SRE), enabling teams to understand, monitor, and maintain complex systems effectively. This tutorial provides an in-depth exploration of observability in the context of SRE, covering its core concepts, architecture, setup, use cases, benefits, limitations, best practices, and comparisons with alternatives. Designed for technical readers, this guide aims to equip SRE practitioners with the knowledge and practical steps to implement observability in their workflows.
What is Observability?
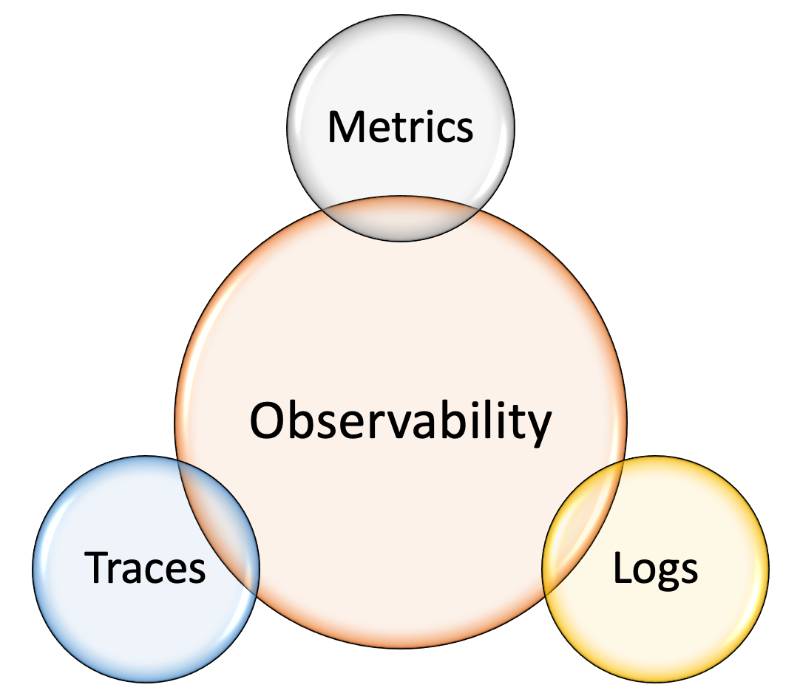
Observability refers to the ability to understand a system’s internal state by examining its external outputs, such as logs, metrics, and traces. Unlike traditional monitoring, which focuses on predefined metrics, observability emphasizes discovering unknown issues in complex, distributed systems.
- Definition: Observability is the measure of how well you can infer a system’s internal behavior from its external outputs.
- Key Outputs:
- Logs: Timestamped records of events.
- Metrics: Numerical data measuring system performance (e.g., CPU usage, request latency).
- Traces: Records of request flows across distributed systems.
History or Background
Observability evolved from monitoring practices as systems grew more distributed with the rise of microservices, cloud computing, and containerization. The term gained prominence in the early 2010s, influenced by control theory and the need to manage unpredictable failures in dynamic environments.
- Timeline:
- Pre-2010: Traditional monitoring focused on uptime and basic metrics (e.g., Nagios, Zabbix).
- 2010–2015: Microservices and cloud adoption highlighted limitations of static monitoring.
- 2015–Present: Tools like Prometheus, Grafana, and Jaeger popularized observability practices, emphasizing logs, metrics, and traces.
Why is it Relevant in Site Reliability Engineering?
SRE aims to balance reliability with rapid development, and observability is foundational to achieving this. It enables proactive issue detection, root cause analysis, and performance optimization in distributed systems.
- Relevance in SRE:
- Incident Response: Quickly identify and resolve issues using detailed system insights.
- Service Level Objectives (SLOs): Measure and maintain service reliability.
- Scalability: Understand system behavior under varying loads.
- Automation: Inform automated scaling and remediation workflows.
Core Concepts & Terminology
Observability in SRE revolves around understanding system behavior through structured data and tools. Below are key concepts and their roles in the SRE lifecycle.
Key Terms and Definitions
| Term | Definition | Example Use Case |
|---|---|---|
| Logs | Event-based records with contextual data (e.g., timestamps, messages). | Debugging a failed API request. |
| Metrics | Quantitative measurements aggregated over time. | Monitoring server CPU usage. |
| Traces | End-to-end tracking of requests across services. | Analyzing latency in microservices. |
| Dashboards | Visual interfaces for real-time system insights. | Grafana dashboard for SLO tracking. |
| Alerting | Automated notifications based on predefined thresholds. | PagerDuty alerts for high error rates. |
How it Fits into the SRE Lifecycle
Observability integrates into the SRE lifecycle at multiple stages:
- Design: Define SLOs and Service Level Indicators (SLIs) based on observable metrics.
- Development: Instrument code with logging and tracing for debugging.
- Deployment: Monitor CI/CD pipelines for deployment failures.
- Operations: Analyze incidents and optimize system performance.
- Post-Incident: Conduct root cause analysis using logs and traces.
Architecture & How It Works
Observability systems are built on components that collect, process, store, and visualize telemetry data. Below is a detailed breakdown of the architecture and its integration points.
Components and Internal Workflow
- Data Collection:
- Agents/Collectors: Tools like Fluentd or Prometheus exporters collect logs, metrics, and traces.
- Instrumentation: Libraries (e.g., OpenTelemetry) embed observability into application code.
- Data Processing:
- Aggregation: Tools like Prometheus aggregate metrics for efficient storage.
- Correlation: Systems like Jaeger correlate traces across services.
- Storage:
- Time-series databases (e.g., Prometheus, InfluxDB) store metrics.
- Log storage systems (e.g., Elasticsearch, Loki) handle logs.
- Visualization and Alerting:
- Dashboards (e.g., Grafana) provide real-time insights.
- Alerting tools (e.g., PagerDuty) notify teams of anomalies.
Architecture Diagram Description
Since images cannot be embedded, here is a textual description of a typical observability architecture:
- Components:
- Applications/Services: Microservices generating telemetry data.
- Instrumentation Layer: OpenTelemetry SDKs embedded in code.
- Collectors: Fluentd (logs), Prometheus (metrics), Jaeger (traces).
- Storage: Elasticsearch (logs), Prometheus (metrics), Jaeger (traces).
- Visualization: Grafana dashboards for unified insights.
- Alerting: PagerDuty for incident notifications.
- Data Flow:
- Applications emit logs, metrics, and traces → Collectors aggregate and forward data → Storage systems index data → Visualization tools query storage for dashboards → Alerts trigger based on thresholds.
          +-------------------+
          |   Applications    |
          |  (Logs, Metrics,  |
          |   Traces, Events) |
          +---------+---------+
                    |
         +----------v-----------+
         | Telemetry Collectors |
         | (OpenTelemetry, etc) |
         +----------+-----------+
                    |
         +----------v-----------+
         |   Data Processing    |
         | (Filtering, Parsing) |
         +----------+-----------+
                    |
     +--------------+--------------+
     |                             |
+----v----+                 +------v------+
|  Storage|                 | Visualization|
| (TSDB,  |                 |  (Grafana,   |
| Elastic)|                 |   Kibana)    |
+----+----+                 +------+-------+
     |                             |
+----v----+                 +------v------+
| Alerting|                 | Automation  |
| (PagerD)|                 | (CI/CD, AI) |
+---------+                 +-------------+
Integration Points with CI/CD or Cloud Tools
- CI/CD: Observability integrates with Jenkins or GitLab CI to monitor pipeline performance (e.g., build times, failure rates).
- Cloud Tools:
- AWS CloudWatch: Centralized logging and metrics for AWS services.
- Google Cloud Operations: Suite for monitoring, logging, and tracing.
- Kubernetes: Prometheus and Grafana for cluster observability.
Installation & Getting Started
This section provides a beginner-friendly guide to setting up a basic observability stack using Prometheus (metrics), Grafana (visualization), and Loki (logs).
Basic Setup or Prerequisites
- System Requirements:
- Linux-based server or Kubernetes cluster.
- Docker installed for containerized deployment.
- Basic knowledge of YAML and command-line tools.
- Tools:
- Prometheus: Metrics collection and storage.
- Grafana: Visualization dashboards.
- Loki: Log aggregation.
- Prerequisites:
- Install Docker:
sudo apt-get install docker.io - Install Docker Compose:
sudo apt-get install docker-compose
- Install Docker:
Hands-On: Step-by-Step Setup Guide
- Set Up Prometheus:
- Create a
prometheus.ymlconfiguration file:
- Create a
global:
  scrape_interval: 15s
scrape_configs:
  - job_name: 'prometheus'
    static_configs:
      - targets: ['localhost:9090']
Run Prometheus using Docker:
docker run -d -p 9090:9090 --name prometheus -v $(pwd)/prometheus.yml:/etc/prometheus/prometheus.yml prom/prometheus2. Set Up Loki:
- Create a
loki-config.ymlfile:
auth_enabled: false
server:
  http_listen_port: 3100
ingester:
  lifecycler:
address: 127.0.0.1- Run Loki using Docker:
docker run -d -p 3100:3100 --name loki -v $(pwd)/loki-config.yml:/etc/loki/loki.yml grafana/loki3. Set Up Grafana:
- Run Grafana using Docker:
docker run -d -p 3000:3000 --name grafana grafana/grafana- Access Grafana at
http://localhost:3000(default login: admin/admin). - Add Prometheus and Loki as data sources in Grafana’s UI.
4. Create a Dashboard:
- In Grafana, create a new dashboard.
- Add a panel to visualize Prometheus metrics (e.g.,
upmetric for system health). - Add a panel for Loki logs using a query like
{job="prometheus"}.
Real-World Use Cases
Observability is applied across industries to ensure system reliability. Below are four SRE scenarios:
- E-Commerce Platform:
- Scenario: Monitor checkout service latency during Black Friday sales.
- Implementation: Use Jaeger to trace request flows, Prometheus for latency metrics, and Grafana for real-time dashboards.
- Outcome: Identified a bottleneck in the payment gateway, reducing checkout time by 30%.
- Financial Services:
- Scenario: Ensure compliance with transaction audit requirements.
- Implementation: Use Loki for centralized logging of transaction events and OpenTelemetry for tracing.
- Outcome: Met regulatory requirements with detailed audit trails.
- Healthcare Systems:
- Scenario: Monitor patient data processing pipelines for availability.
- Implementation: Prometheus monitors pipeline uptime, with alerts via PagerDuty for downtime.
- Outcome: Achieved 99.99% uptime for critical systems.
- Gaming Industry:
- Scenario: Detect lag in multiplayer game servers.
- Implementation: Use Prometheus for server metrics and Grafana for latency dashboards.
- Outcome: Reduced player complaints by optimizing server resources.
Benefits & Limitations
Key Advantages
- Proactive Issue Detection: Identify issues before they impact users.
- Improved Debugging: Traces and logs pinpoint root causes in distributed systems.
- Data-Driven Decisions: Metrics inform capacity planning and SLOs.
- Scalability: Handles large-scale, dynamic systems effectively.
Common Challenges or Limitations
- Data Volume: High telemetry data can strain storage and processing resources.
- Complexity: Requires expertise to instrument and configure tools.
- Cost: Cloud-based observability solutions can be expensive.
- Alert Fatigue: Poorly configured alerts lead to noise and reduced effectiveness.
Best Practices & Recommendations
Security Tips
- Access Control: Restrict access to observability tools using RBAC (e.g., Grafana’s role-based access).
- Data Encryption: Use TLS for data transmission between collectors and storage.
- Sensitive Data: Mask sensitive information in logs (e.g., PII) using tools like Fluentd filters.
Performance
- Sampling: Sample traces to reduce data volume without losing insights.
- Retention Policies: Set appropriate data retention (e.g., 15 days for metrics, 30 days for logs).
- Aggregation: Aggregate metrics at the collector level to optimize storage.
Maintenance
- Regular Updates: Keep observability tools updated to avoid vulnerabilities.
- Dashboard Hygiene: Regularly review and prune unused dashboards.
Compliance Alignment
- Align with standards like GDPR or HIPAA by ensuring logs are anonymized and audit trails are maintained.
Automation Ideas
- Automate alert thresholds using machine learning (e.g., Prometheus’s alerting rules).
- Integrate with CI/CD pipelines to monitor deployment health.
Comparison with Alternatives
| Feature/Tool | Observability (Prometheus, Grafana, Loki) | Traditional Monitoring (Nagios, Zabbix) | Cloud-Native (AWS CloudWatch) |
|---|---|---|---|
| Focus | Logs, metrics, traces for dynamic systems | Predefined metrics, uptime monitoring | Cloud service monitoring |
| Scalability | High, designed for distributed systems | Limited for large-scale systems | High, cloud-optimized |
| Cost | Open-source, low cost | Open-source, low cost | Subscription-based |
| Flexibility | Highly customizable | Less flexible, static checks | Limited to cloud ecosystem |
| Use Case | Microservices, Kubernetes | Legacy systems, on-premises | AWS-based applications |
When to Choose Observability
- Choose Observability: For distributed systems, microservices, or Kubernetes where dynamic insights are critical.
- Choose Alternatives: Traditional monitoring for simple, on-premises systems; cloud-native tools for tightly integrated cloud environments.
Conclusion
Observability is indispensable in SRE, enabling teams to maintain reliable, scalable systems in complex environments. By leveraging logs, metrics, and traces, SREs can proactively manage incidents, optimize performance, and meet SLOs. As systems grow more distributed, observability will evolve with advancements in AI-driven analytics and automated remediation.
Future Trends
- AI-Powered Observability: Machine learning for anomaly detection and predictive maintenance.
- Unified Telemetry: Greater adoption of OpenTelemetry for standardized data collection.
- Serverless Observability: Tailored solutions for serverless architectures.
Next Steps
- Explore tools like Prometheus, Grafana, and Jaeger hands-on.
- Join communities like the CNCF (Cloud Native Computing Foundation) for observability best practices.
- Official Resources:
- Prometheus Documentation
- Grafana Documentation
- Loki Documentation
- OpenTelemetry