Introduction & Overview
In the realm of Site Reliability Engineering (SRE), ensuring the performance and reliability of systems is paramount. Request latency, a critical metric, measures the time it takes for a system to process and respond to a user or system request. It is a cornerstone of user experience and system performance in distributed systems, directly impacting customer satisfaction and operational efficiency. This tutorial provides an in-depth exploration of request latency, its significance in SRE, and practical guidance for monitoring and optimizing it.
What is Request Latency?
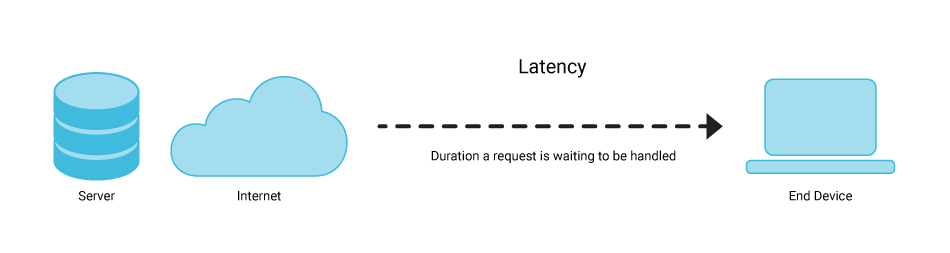
Request latency is the duration between the initiation of a request (e.g., an HTTP request, database query, or API call) and the receipt of a response. It is typically measured in milliseconds or seconds and reflects the responsiveness of a system from a user’s perspective.
- Key Components: Includes time spent in network transmission, server processing, queueing, and response delivery.
- Measurement: Often tracked as percentiles (e.g., p50, p90, p99) to capture the distribution of response times.
- Example: For a web service, latency is the time from when a user clicks a button to when the page content loads.
History or Background
The concept of request latency has roots in early computing, where system performance was measured by response times. With the advent of distributed systems and cloud computing, latency became a critical metric for SRE, pioneered by Google in the early 2000s. Google’s SRE practices emphasized measurable Service Level Indicators (SLIs) like latency to define Service Level Objectives (SLOs), ensuring systems meet user expectations. Today, latency monitoring is a standard practice across industries, driven by the need for real-time, scalable applications.
- In early distributed systems (1990s–2000s), performance metrics mostly focused on throughput.
- With cloud computing, microservices, and real-time apps, latency emerged as a primary reliability metric.
- Google’s SRE book introduced latency as a key metric tied to SLIs, SLOs, and SLAs.
- Today, tools like Prometheus, Datadog, New Relic, AWS CloudWatch, and Grafana track latency at scale.
Why is it Relevant in Site Reliability Engineering?
Request latency is a core SLI in SRE, directly tied to system reliability and user satisfaction. It helps SREs:
- Ensure User Experience: High latency can lead to user dissatisfaction, churn, or revenue loss (e.g., slow e-commerce checkouts).
- Detect System Issues: Spikes in latency often indicate bottlenecks, resource contention, or failures.
- Balance Reliability and Innovation: By monitoring latency, SREs use error budgets to prioritize reliability work versus feature development.
- Support Scalability: Understanding latency helps in capacity planning and load testing for growing systems.
Core Concepts & Terminology
Key Terms and Definitions
- Service Level Indicator (SLI): A quantitative measure of service performance, such as request latency or error rate.
- Service Level Objective (SLO): A target value or range for an SLI (e.g., 99% of requests < 400ms).
- Service Level Agreement (SLA): A contract with users specifying consequences for missing SLOs.
- Percentile Latency: Measures latency at specific points in the distribution (e.g., p99 = latency for the slowest 1% of requests).
- Error Budget: The acceptable amount of failure (e.g., 100% – SLO) to balance reliability and development velocity.
- Toil: Manual, repetitive tasks that SREs aim to automate to reduce operational overhead.
| Term | Definition | Example |
|---|---|---|
| Latency | Time taken for a request to be completed | 200 ms API response |
| P50 / P90 / P95 / P99 Latency | Percentile latencies showing distribution | P99 = worst 1% requests |
| SLA (Service Level Agreement) | External contract with users | 99.9% of requests < 500ms |
| SLO (Service Level Objective) | Internal goal for reliability | 95% of requests < 300ms |
| SLI (Service Level Indicator) | Measurable metric of performance | API latency = 220 ms |
| Tail Latency | Performance of worst-case requests | 1% slowest requests |
| Throughput vs Latency | Requests/sec vs time per request | High throughput ≠ low latency |
How It Fits into the Site Reliability Engineering Lifecycle
Request latency is integral to the SRE lifecycle, which includes design, deployment, monitoring, and incident response:
- Design Phase: SREs collaborate with developers to design systems with low-latency architectures (e.g., caching, load balancing).
- Deployment Phase: Latency is monitored during canary releases to detect performance regressions.
- Monitoring Phase: Real-time latency tracking identifies anomalies and triggers alerts.
- Incident Response: Latency spikes often signal incidents, prompting root cause analysis and remediation.
- Postmortem: Latency-related incidents lead to blameless postmortems to improve system resilience.
| Phase | Role of Request Latency |
|---|---|
| Design | Guide architecture decisions (e.g., caching, database optimization). |
| Deployment | Validate performance during releases using latency metrics. |
| Monitoring | Track latency as an SLI to ensure SLO compliance and detect issues. |
| Incident Response | Use latency spikes to identify and prioritize incidents. |
| Postmortem | Analyze latency-related failures to improve processes and automation. |
Architecture & How It Works
Components and Internal Workflow
Request latency involves multiple components in a distributed system:
- Client: Initiates the request (e.g., a browser, mobile app, or another service).
- Network: Transmits the request and response, introducing network latency (e.g., DNS resolution, TCP handshake).
- Load Balancer: Distributes requests across servers, affecting queueing time.
- Application Server: Processes the request, including business logic and computations.
- Backend Services: Includes databases, caches, or APIs, each contributing to processing time.
- Monitoring System: Collects and aggregates latency metrics for analysis and alerting.
Workflow:
- A client sends a request to a load balancer.
- The load balancer routes the request to an application server.
- The server processes the request, querying backend services as needed.
- The response is sent back through the network to the client.
- Monitoring tools capture latency at each stage (e.g., network, server, backend).
Architecture Diagram
Below is a textual description of the architecture diagram for request latency monitoring in an SRE context:
[Client] --> [Internet] --> [Load Balancer]
                                     |
                                     v
                           [Application Servers]
                                     |
                                     v
                           [Backend Services: DB, Cache, API]
                                     |
                                     v
                           [Monitoring System: Prometheus, Grafana]
                                     |
                                     v
                           [Alerting System: PagerDuty]
- Client: A user device or service sending requests.
- Internet: Represents network latency (e.g., DNS, routing).
- Load Balancer: Distributes traffic (e.g., NGINX, AWS ELB).
- Application Servers: Process requests (e.g., Node.js, Java).
- Backend Services: Databases (e.g., MySQL), caches (e.g., Redis), or APIs.
- Monitoring System: Collects latency metrics (e.g., Prometheus) and visualizes them (e.g., Grafana).
- Alerting System: Notifies SREs of latency spikes (e.g., PagerDuty).
Integration Points with CI/CD or Cloud Tools
- CI/CD Pipelines: Latency metrics are integrated into CI/CD pipelines to validate releases. Tools like Jenkins or GitLab CI can trigger latency tests during canary deployments.
- Cloud Tools: Cloud providers like AWS (CloudWatch), GCP (Stackdriver), or Azure (Monitor) offer latency monitoring. Prometheus and Grafana are commonly used for custom setups.
- Automation: Tools like Terraform or Kubernetes automate infrastructure provisioning, ensuring low-latency configurations.
- Distributed Tracing: Tools like Jaeger or OpenTelemetry trace requests across services to identify latency bottlenecks.
Installation & Getting Started
Basic Setup or Prerequisites
To monitor request latency, you need:
- A Running Service: A web application or API (e.g., Node.js, Python Flask).
- Monitoring Tool: Prometheus for metrics collection and Grafana for visualization.
- Instrumentation Library: Language-specific libraries (e.g.,
prom-clientfor Node.js). - Environment: A server or cloud environment (e.g., AWS EC2, Kubernetes).
- Dependencies: Docker for running Prometheus/Grafana, and basic knowledge of HTTP and metrics.
Hands-On: Step-by-Step Beginner-Friendly Setup Guide
This guide sets up request latency monitoring for a Node.js application using Prometheus and Grafana.
- Install Node.js and Dependencies:
- Install Node.js and npm.
- Create a Node.js app and install
npm init -y
npm install express prom-client
2. Instrument the Application:
- Create a simple Express app with latency metrics:
const express = require('express');
const prom = require('prom-client');
const app = express();

// Create a Histogram for latency
const requestLatency = new prom.Histogram({
  name: 'http_request_duration_seconds',
  help: 'HTTP request latency in seconds',
  labelNames: ['method', 'route', 'status_code'],
  buckets: [0.01, 0.05, 0.1, 0.5, 1, 2.5, 5, 10]
});

// Middleware to measure latency
app.use((req, res, next) => {
  const start = Date.now();
  res.on('finish', () => {
    const duration = (Date.now() - start) / 1000;
    requestLatency.observe({ method: req.method, route: req.path, status_code: res.statusCode }, duration);
  });
  next();
});

// Sample endpoint
app.get('/', (req, res) => res.send('Hello, World!'));

// Expose metrics endpoint
app.get('/metrics', async (req, res) => {
  res.set('Content-Type', prom.register.contentType);
  res.end(await prom.register.metrics());
});

app.listen(3000, () => console.log('Server running on port 3000'));
3. Set Up Prometheus:
- Create a
prometheus.ymlconfiguration file:
global:
  scrape_interval: 15s
scrape_configs:
  - job_name: 'node-app'
    static_configs:
- targets: ['localhost:3000']- Run Prometheus using Docker:
docker run -p 9090:9090 -v $(pwd)/prometheus.yml:/etc/prometheus/prometheus.yml prom/prometheus4. Set Up Grafana:
- Run Grafana using Docker:
docker run -p 3001:3000 grafana/grafana
- Access Grafana at
http://localhost:3001, log in (default: admin/admin), and add Prometheus as a data source (http://localhost:9090). - Create a dashboard to visualize
http_request_duration_secondsmetrics (e.g., p50, p90, p99 latency).
5. Test the Setup:
- Send requests to
http://localhost:3000/usingcurlor a browser. - View metrics at
http://localhost:3000/metrics. - Check Prometheus at
http://localhost:9090and queryhttp_request_duration_seconds. - Visualize latency in Grafana dashboards.
Real-World Use Cases
Request latency monitoring is critical across industries. Below are four real-world SRE scenarios:
- E-Commerce Platform:
- Scenario: An online retailer (e.g., Amazon) monitors checkout API latency to ensure fast transactions during peak sales (e.g., Black Friday).
- Application: SREs set an SLO of 99% of requests < 500ms. Prometheus tracks latency, and alerts trigger if p99 exceeds 500ms, prompting autoscaling or database optimization.
- Industry Impact: Low latency reduces cart abandonment, increasing revenue.
- Ride-Hailing App:
- Scenario: A ride-hailing service (e.g., Uber) tracks latency for ride request APIs to ensure quick driver assignments.
- Application: SREs use distributed tracing (Jaeger) to identify latency in matching algorithms or database queries, maintaining an SLO of 99% of requests < 200ms.
- Industry Impact: Fast responses improve user satisfaction and driver efficiency.
- Financial Trading System:
- Scenario: A stock trading platform monitors API latency for trade executions to meet strict regulatory requirements.
- Application: SREs use GPU-accelerated systems and monitor p99 latency (< 10ms) with NVIDIA DCGM and Prometheus, optimizing data transfers to reduce latency.
- Industry Impact: Low latency ensures compliance and competitive advantage.
- Streaming Service:
- Scenario: A video streaming platform (e.g., Netflix) monitors latency for content delivery APIs to prevent buffering.
- Application: SREs use CDN metrics and OpenTelemetry to track latency across edge servers, maintaining an SLO of 99% of requests < 100ms.
- Industry Impact: Low latency enhances viewer experience, reducing churn.
Benefits & Limitations
Key Advantages
- Improved User Experience: Low latency ensures responsive applications, enhancing customer satisfaction.
- Proactive Issue Detection: Latency monitoring identifies bottlenecks before they impact users.
- Data-Driven Decisions: Percentile metrics enable precise SLOs and error budgets.
- Scalability Insights: Latency trends inform capacity planning and autoscaling strategies.
Common Challenges or Limitations
- Complexity in Distributed Systems: Tracing latency across microservices is challenging.
- False Positives: Transient latency spikes may trigger unnecessary alerts.
- Resource Overhead: Monitoring latency at scale requires significant compute and storage.
- Interpretation: High percentiles (e.g., p99) may not reflect typical user experience, leading to over-optimization.
| Aspect | Benefit | Limitation |
|---|---|---|
| User Experience | Enhances responsiveness | High percentiles may mislead typical experience |
| Issue Detection | Identifies bottlenecks early | Transient spikes cause false alerts |
| Scalability | Informs capacity planning | Monitoring at scale is resource-intensive |
| Data Analysis | Enables precise SLOs | Complex to trace in distributed systems |
Best Practices & Recommendations
Security Tips
- Secure Metrics Endpoints: Restrict access to
/metricsendpoints using authentication or network policies. - Encrypt Data: Use TLS for request transmission to prevent latency manipulation by attackers.
- Audit Logs: Maintain logs for latency metrics to ensure compliance with security standards.
Performance
- Optimize Percentiles: Focus on p90/p99 for latency SLOs to capture outliers without overreacting to transients.
- Use Caching: Implement Redis or Memcached to reduce backend latency.
- Load Balancing: Use GPU-aware load balancers for low-latency APIs (e.g., NGINX with GPU plugins).
Maintenance
- Automate Monitoring: Use Prometheus exporters to automate metric collection.
- Regular SLO Reviews: Adjust latency SLOs based on user feedback and business needs.
- Chaos Engineering: Use tools like Gremlin to test latency under failure conditions.
Compliance Alignment
- Regulatory Standards: Ensure latency SLOs align with industry regulations (e.g., GDPR for data access, PCI-DSS for payments).
- Auditability: Store latency metrics for compliance audits using tools like Datadog.
Automation Ideas
- Auto-Scaling: Implement auto-scaling rules based on latency thresholds (e.g., AWS Auto Scaling).
- Self-Healing: Use Kubernetes to restart pods with high latency.
- Alerting Rules: Set Prometheus alerts for sustained p99 latency increases:
- alert: HighLatency
  expr: histogram_quantile(0.99, sum(rate(http_request_duration_seconds_bucket[5m])) by (le)) > 0.5
  for: 5m
  labels:
    severity: critical
  annotations:
    summary: "High p99 latency detected"
    description: "p99 latency exceeds 500ms for 5 minutes."
Comparison with Alternatives
Alternatives to Request Latency Monitoring
- Throughput: Measures requests per second, focusing on system capacity rather than response time.
- Error Rate: Tracks failed requests, prioritizing reliability over performance.
- Saturation: Monitors resource utilization (e.g., CPU, memory), indicating system stress.
Comparison Table
| Metric | Focus | Strength | Weakness | When to Use |
|---|---|---|---|---|
| Request Latency | Response time | Direct user experience impact | Complex in distributed systems | User-facing performance critical |
| Throughput | Request volume | Measures system capacity | Ignores response time | Capacity planning, load testing |
| Error Rate | Failed requests | Highlights reliability issues | Misses performance degradation | Reliability-focused SLOs |
| Saturation | Resource utilization | Predicts system overload | Indirect user impact | Infrastructure health monitoring |
When to Choose Request Latency
- Choose Latency: When user experience (e.g., page load time, API response) is critical, or for real-time applications (e.g., trading, gaming).
- Choose Alternatives: Use throughput for capacity planning, error rate for reliability-focused systems, or saturation for infrastructure health.
Conclusion
Request latency is a vital SLI in SRE, directly impacting user satisfaction and system reliability. By monitoring latency, SREs can detect issues, optimize performance, and balance innovation with stability. This tutorial covered its definition, integration into the SRE lifecycle, setup with Prometheus and Grafana, real-world applications, and best practices. As systems grow more complex, future trends include AI-driven latency prediction and self-healing architectures.
Next Steps
- Experiment: Set up latency monitoring for a personal project using the provided guide.
- Learn More: Explore advanced topics like distributed tracing with Jaeger or chaos engineering with Gremlin.
- Engage: Join SRE communities for practical insights and collaboration.
Official Docs and Communities
- Prometheus Documentation: https://prometheus.io/docs/
- Grafana Documentation: https://grafana.com/docs/
- SRE Communities: Reddit (/r/sre), Google SRE Book (https://sre.google/sre-book/), and SquareOps Blog (https://squareops.com/).