Introduction & Overview
What is a Service Mesh?
A service mesh is a dedicated infrastructure layer that manages, controls, and observes service-to-service communication within a microservices architecture. It abstracts the complexities of network communication, such as load balancing, service discovery, security, and observability, away from application code, enabling developers to focus on business logic while ensuring reliable, secure, and observable interactions between services.
History or Background
The concept of service meshes emerged around 2016 as microservices architectures gained popularity. Companies like Twitter, Netflix, and Google faced challenges managing complex service interactions at scale, leading to the development of tools like Linkerd (created by Buoyant) and Istio (founded by Google, IBM, and Lyft). These tools standardized communication management, reducing the need for custom networking code. Service meshes have since become integral to cloud-native ecosystems, particularly with the rise of Kubernetes.
- Pre-2010s: Monolithic applications handled communication internally.
- 2010–2015: Rise of microservices, creating complex communication patterns (east-west traffic).
- 2016: Lyft introduced Envoy Proxy, which became the backbone of service mesh technologies.
- 2017: Google, IBM, and Lyft released Istio, the first mainstream service mesh.
- Now (2025): Service meshes like Istio, Linkerd, Consul, Kuma, and AWS App Mesh are widely adopted in cloud-native environments.
Why is it Relevant in Site Reliability Engineering?
Site Reliability Engineering (SRE) focuses on ensuring system reliability, scalability, and performance. Service meshes align with SRE principles by:
- Enhancing Reliability: Features like retries, timeouts, and circuit breaking prevent cascading failures.
- Improving Observability: Metrics, tracing, and logging provide insights into system health.
- Simplifying Scalability: Automated service discovery and load balancing support dynamic scaling.
- Reducing Toil: Centralized management of communication policies reduces manual operational overhead.
Core Concepts & Terminology
Key Terms and Definitions
- Data Plane: Handles traffic between services using lightweight proxies (e.g., Envoy, Linkerd-proxy) deployed as sidecars or node-based agents.
- Control Plane: Manages the data plane, handling configuration, service discovery, and policy enforcement (e.g., Istiod in Istio).
- Sidecar Proxy: A proxy deployed alongside each microservice instance to intercept and manage traffic.
- Mutual TLS (mTLS): Encrypts service-to-service communication for security.
- Service Discovery: Dynamically identifies available services in the mesh.
- Observability: Collects metrics, logs, and traces to monitor service interactions.
- Circuit Breaking: Halts requests to failing services to prevent system overload.
- Canary Deployment: Gradually routes traffic to new service versions for testing.
| Term | Definition | Example in Service Mesh |
|---|---|---|
| Sidecar Proxy | A proxy deployed alongside each service instance to handle communication. | Envoy, Linkerd-proxy |
| Control Plane | Manages policies, configurations, and rules for proxies. | Istio Pilot, Consul Control Plane |
| Data Plane | Handles actual traffic between services (via sidecars). | Envoy sidecars |
| mTLS (Mutual TLS) | Encrypts service-to-service communication and authenticates identities. | Secure pod-to-pod communication |
| Traffic Shaping | Controlling request routing, retries, failovers, etc. | Canary deployments |
| Observability | Collecting telemetry data like metrics, logs, and traces. | Prometheus + Jaeger integration |
How It Fits into the SRE Lifecycle
Service meshes support the SRE lifecycle (design, build, operate, monitor, and improve) as follows:
- Design & Build: Simplifies microservice communication, reducing development complexity.
- Operate: Automates traffic management and fault tolerance, minimizing manual intervention.
- Monitor: Provides detailed telemetry for proactive issue detection.
- Improve: Enables chaos engineering and A/B testing to optimize system performance.
Architecture & How It Works
Components and Internal Workflow
A service mesh consists of two primary components:
- Data Plane:
- Comprises proxies (e.g., Envoy) deployed as sidecars or node agents.
- Intercepts all inbound and outbound traffic for a service.
- Handles tasks like load balancing, retries, timeouts, and encryption.
- Control Plane:
- Centralized management layer (e.g., Istiod in Istio, Linkerd control plane).
- Configures proxies, manages service discovery, and enforces policies.
- Collects telemetry data for observability tools like Prometheus or Grafana.
Workflow:
- A microservice sends a request, intercepted by its sidecar proxy.
- The proxy applies routing rules, authentication, and encryption based on control plane configurations.
- The request is forwarded to the destination service’s proxy, which delivers it to the service.
- Metrics and logs are collected and sent to monitoring tools.
Architecture Diagram
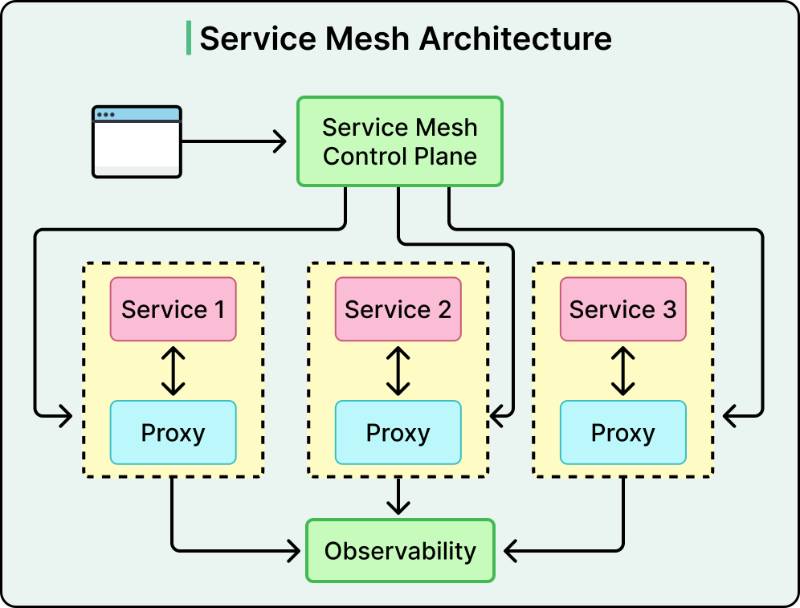
Below is a textual description of a typical service mesh architecture (image generation requires confirmation):
- Nodes/Pods: Each microservice runs in a Kubernetes pod with a sidecar proxy (e.g., Envoy).
- Data Plane: Proxies form a network, handling service-to-service traffic.
- Control Plane: A central component (e.g., Istiod) communicates with all proxies, pushing configurations and collecting telemetry.
- Observability Tools: Prometheus, Grafana, and Jaeger integrate to visualize metrics, logs, and traces.
- External Traffic: An ingress gateway (e.g., Istio Gateway) manages external requests entering the mesh.
Diagram Description:
[Client] --> [Ingress Gateway] --> [Service A + Sidecar Proxy] --> [Service B + Sidecar Proxy]
                                    |                               |
                                    v                               v
                            [Control Plane (Istiod)] <--> [Observability Tools]
Integration Points with CI/CD or Cloud Tools
- CI/CD: Service meshes integrate with tools like Jenkins, GitLab CI, or ArgoCD to automate canary deployments and rollbacks.
- Cloud Tools: Compatible with Kubernetes, AWS App Mesh, Google Cloud Traffic Director, and Azure Service Fabric.
- Observability: Integrates with Prometheus, Grafana, Jaeger, and Kiali for monitoring and visualization.
- Security: Supports SPIFFE for workload identity and mTLS for encryption.
Installation & Getting Started
Basic Setup or Prerequisites
- Kubernetes Cluster: A running cluster (e.g., Minikube, EKS, GKE).
- kubectl: Command-line tool for Kubernetes.
- Istio CLI (istioctl): For installing and managing Istio.
- Helm: Optional for simplified deployment.
- Hardware: At least 4 CPU cores, 8GB RAM for a test cluster.
- Network Access: Ensure cluster nodes can communicate.
Hands-on: Step-by-Step Beginner-Friendly Setup Guide (Istio on Kubernetes)
This guide installs Istio, a popular service mesh, on a Kubernetes cluster.
- Download Istio:
curl -L https://istio.io/downloadIstio | sh -
cd istio-*
export PATH=$PWD/bin:$PATH
2. Install Istio:
istioctl install --set profile=demo -y3. Enable Automatic Sidecar Injection:
Label the namespace to auto-inject Envoy sidecars:
kubectl label namespace default istio-injection=enabled4. Deploy a Sample Application:
Deploy the Istio Bookinfo application:
kubectl apply -f samples/bookinfo/platform/kube/bookinfo.yaml5. Verify Installation:
Check pod status and sidecar injection:
kubectl get pods -n default6. Access the Application:
Set up an ingress gateway and access the app:
kubectl apply -f samples/bookinfo/networking/bookinfo-gateway.yaml
export INGRESS_HOST=$(kubectl -n istio-system get service istio-ingressgateway -o jsonpath='{.status.loadBalancer.ingress[0].ip}')
curl http://$INGRESS_HOST/productpage
7. Enable Observability:
Launch Kiali dashboard for visualization:
istioctl dashboard kialiFor detailed instructions, refer to the Istio Official Documentation.
Real-World Use Cases
Scenario 1: E-Commerce Platform Reliability
- Context: An e-commerce platform with microservices for user authentication, product catalog, and payment processing faces outages due to service failures.
- Solution: Implement Istio to enable circuit breaking and retries. For example, if the payment service fails, Istio retries requests or redirects to a fallback service, reducing downtime.
- Outcome: Improved uptime by 40% and faster incident resolution, aligning with SRE goals of reliability.
Scenario 2: Financial Services Security
- Context: A banking application requires secure communication for sensitive transactions.
- Solution: Use Istio’s mTLS to encrypt service-to-service traffic and enforce access policies. Kiali visualizes traffic flows to detect anomalies.
- Outcome: Enhanced security compliance and reduced risk of data breaches.
Scenario 3: Scalable Media Streaming
- Context: A streaming service needs to scale dynamically during peak usage.
- Solution: Linkerd’s load balancing and service discovery ensure efficient traffic distribution across new service instances.
- Outcome: Seamless scaling with minimal latency impact, supporting SRE scalability objectives.
Scenario 4: Chaos Engineering for Resilience
- Context: A cloud provider wants to test system resilience under failure conditions.
- Solution: Use Istio’s fault injection to simulate service failures and observe recovery mechanisms.
- Outcome: Identified and mitigated weaknesses, reducing unplanned downtime by 30%.
Benefits & Limitations
Key Advantages
- Reliability: Automated retries, timeouts, and circuit breaking enhance system resilience.
- Security: mTLS and access controls ensure secure communication.
- Observability: Comprehensive metrics, logs, and traces improve monitoring.
- Developer Productivity: Abstracts networking complexity, allowing focus on business logic.
Common Challenges or Limitations
- Complexity: Adds operational overhead, requiring expertise to manage.
- Performance Overhead: Sidecar proxies can increase latency (up to 185% in some cases).
- Resource Consumption: Proxies require additional CPU and memory.
- Learning Curve: Steep for teams new to cloud-native technologies.
Table: Benefits vs. Limitations
| Aspect | Benefits | Limitations |
|---|---|---|
| Reliability | Automated retries, circuit breaking | Potential latency increase |
| Security | mTLS, access controls | Configuration complexity |
| Observability | Metrics, logs, traces | Resource-intensive proxies |
| Scalability | Dynamic service discovery, load balancing | Steep learning curve |
Best Practices & Recommendations
Security Tips
- Enable mTLS for all services to ensure encrypted communication.
- Use SPIFFE-based identities for secure service authentication.
- Regularly audit access policies with tools like Kiali.
Performance
- Optimize proxy configurations to minimize latency (e.g., reduce logging verbosity).
- Use node-based proxies (e.g., Calico’s Envoy) for resource efficiency.
- Monitor resource usage with Prometheus and Grafana.
Maintenance
- Automate service mesh upgrades using Helm or CI/CD pipelines.
- Regularly test configurations with chaos engineering tools.
- Maintain a central dashboard for real-time system health monitoring.
Compliance Alignment
- Ensure mTLS and access controls meet regulatory requirements (e.g., GDPR, HIPAA).
- Log all traffic metadata for audit trails.
Automation Ideas
- Integrate with ArgoCD for automated deployment of mesh configurations.
- Use Terraform to manage control plane infrastructure.
- Automate observability with pre-configured Prometheus and Grafana dashboards.
Comparison with Alternatives
Alternatives to Service Mesh
- Libraries/Frameworks: Libraries like Netflix’s Hystrix or Spring Cloud embed communication logic in application code.
- API Gateways: Manage external traffic (e.g., NGINX, Kong) but lack fine-grained service-to-service control.
- eBPF-Based Solutions: Emerging technology (e.g., Cilium) for lightweight networking without sidecars.
Table: Service Mesh vs. Alternatives
| Feature | Service Mesh | Libraries/Frameworks | API Gateway | eBPF |
|---|---|---|---|---|
| Traffic Management | Advanced (e.g., canary) | Basic | External traffic only | Lightweight routing |
| Security | mTLS, access controls | Manual implementation | Limited to ingress | Kernel-level security |
| Observability | Comprehensive telemetry | Limited metrics | Basic logging | High-performance traces |
| Complexity | High | Moderate | Low | Moderate |
| Use Case | Microservices | Monoliths, simple apps | External APIs | High-performance needs |
When to Choose Service Mesh
- Choose Service Mesh: For complex microservices architectures requiring advanced traffic management, security, and observability.
- Choose Alternatives: For simpler applications, monoliths, or when resource constraints prioritize lightweight solutions like eBPF.
Conclusion
Final Thoughts
Service meshes are a cornerstone of modern SRE practices, enabling reliable, secure, and observable microservices communication. They reduce operational toil and align with SRE goals of scalability and resilience. However, their complexity and resource demands require careful planning and expertise.
Future Trends
- Ambient Mesh: Istio’s sidecar-less approach (e.g., ztunnel) reduces resource overhead.
- eBPF Integration: Lightweight networking alternatives may complement or replace traditional meshes.
- AI-Driven SRE: Service meshes may integrate with AI for predictive scaling and anomaly detection.
Next Steps
- Experiment with Istio or Linkerd in a test Kubernetes cluster.
- Explore observability tools like Kiali and Jaeger for deeper insights.
- Join communities like the Cloud Native Computing Foundation (CNCF) for updates.
Official Documentation and Communities
- Istio: https://istio.io/latest/docs/
- Linkerd: https://linkerd.io/docs/
- CNCF Service Mesh Working Group: https://www.cncf.io/
- Kong Mesh: https://konghq.com/kong-mesh