Introduction & Overview
What is SLIs as Code?
SLIs as Code refers to the practice of defining, managing, and monitoring Service Level Indicators (SLIs) using code-based configurations, typically in version-controlled files like YAML, JSON, or scripts. This approach integrates SLIs into the software development lifecycle, allowing Site Reliability Engineers (SREs) to programmatically define metrics such as latency, availability, and error rates, and track them alongside application code. By treating SLIs as code, teams can automate monitoring, ensure consistency, and align reliability metrics with business objectives.
History or Background
The concept of SLIs as Code emerged from the broader Infrastructure as Code (IaC) paradigm, popularized by tools like Terraform and Ansible, and the rise of Site Reliability Engineering at companies like Google in the early 2000s. As systems grew more complex with microservices and cloud-native architectures, manual SLI tracking became inefficient. By 2016, with the publication of Google’s Site Reliability Engineering book, the importance of codifying SLIs to align with SLOs (Service Level Objectives) and SLAs (Service Level Agreements) gained traction. Tools like Prometheus and OpenSLO further standardized this practice by providing frameworks to define SLIs programmatically.
Why is it Relevant in Site Reliability Engineering?
SLIs as Code is critical in SRE because it:
- Automates Reliability Tracking: Codified SLIs enable automated monitoring and alerting, reducing manual toil.
- Improves Collaboration: Developers, SREs, and business teams can align on reliability metrics stored in version control.
- Supports Scalability: Programmatic SLIs scale with distributed systems, ensuring consistent measurement across microservices.
- Enables Data-Driven Decisions: Codified metrics provide real-time insights into system health, guiding prioritization of reliability vs. feature development.
Core Concepts & Terminology
Key Terms and Definitions
| Term | Definition |
|---|---|
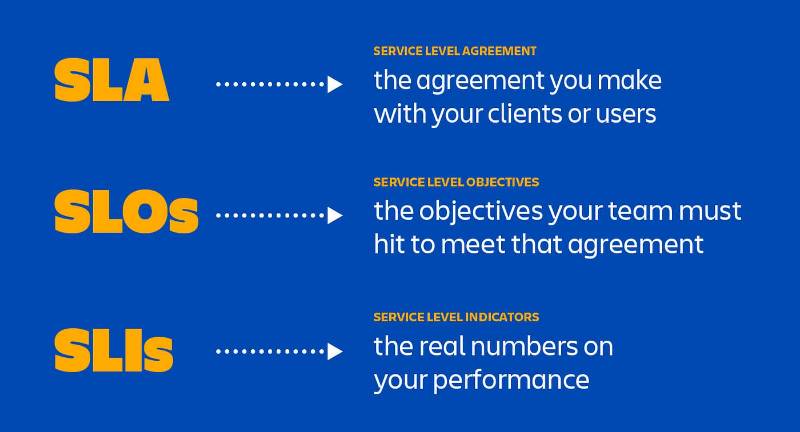
| SLI (Service Level Indicator) | A quantitative metric measuring service performance (e.g., latency, availability). |
| SLO (Service Level Objective) | A target or range for an SLI (e.g., 99.9% availability over 30 days). |
| SLA (Service Level Agreement) | A contractual agreement with consequences for failing to meet SLOs. |
| SLIs as Code | Defining and managing SLIs using code, typically in YAML/JSON, stored in version control. |
| Error Budget | The acceptable failure rate for a service, derived from SLOs (e.g., 0.1% downtime for 99.9% availability). |
How It Fits into the Site Reliability Engineering Lifecycle
SLIs as Code integrates into the SRE lifecycle as follows:
- Design Phase: Define SLIs based on user journeys and business needs.
- Development Phase: Codify SLIs in configuration files alongside application code.
- Deployment Phase: Integrate SLI monitoring into CI/CD pipelines for automated validation.
- Monitoring Phase: Use tools like Prometheus or Grafana to track SLIs in real-time.
- Incident Response: SLIs guide post-incident analysis, identifying breaches in SLOs.
- Optimization Phase: Refine SLIs based on performance data and user feedback.
Architecture & How It Works
Components
- SLI Definitions: YAML/JSON files specifying metrics (e.g., latency, error rate).
- Monitoring Tools: Systems like Prometheus, Datadog, or New Relic to collect and process SLI data.
- Version Control: Git repositories to store and track SLI configurations.
- Alerting Systems: Tools to notify teams of SLO breaches (e.g., PagerDuty, Slack integrations).
- Dashboards: Visualization platforms like Grafana for real-time SLI monitoring.
Internal Workflow
- Define SLIs: Engineers write SLI specifications in code (e.g., YAML files for OpenSLO).
- Store in Version Control: SLI files are committed to a Git repository, enabling change tracking.
- Integrate with Monitoring: Tools like Prometheus parse SLI definitions and collect metrics.
- Automate Alerts: Breaches in SLOs trigger alerts via integrated systems.
- Visualize and Analyze: Dashboards display SLI performance, aiding decision-making.
Architecture Diagram Description
The architecture for SLIs as Code involves:
- Git Repository: Stores SLI configuration files (e.g.,
sli.yaml). - CI/CD Pipeline: Validates and deploys SLI configurations to monitoring systems.
- Monitoring System: Prometheus scrapes metrics from services and matches them against SLI definitions.
- Alerting System: Sends notifications when SLOs are breached.
- Dashboard: Grafana visualizes SLI trends and SLO compliance.
Diagram (Text-Based Representation):
[Application Services] --> [Metrics Exporter] --> [Prometheus]
        |                            |                 |
        |                            |                 v
[SLI Definitions in Git] --> [CI/CD Pipeline] --> [SLO Validation]
        |                                              |
        v                                              v
[Dashboards (Grafana)] <--- [Alerting (PagerDuty)] <--- [SLO Breaches]
Integration Points with CI/CD or Cloud Tools
- CI/CD: Tools like Jenkins or GitHub Actions validate SLI configurations and deploy them to monitoring systems.
- Cloud Tools: AWS CloudWatch, Google Cloud Operations Suite, or Azure Monitor integrate with SLI definitions for cloud-native metrics.
- Observability Platforms: Datadog and New Relic support custom SLI metrics via APIs.
Installation & Getting Started
Basic Setup or Prerequisites
- Version Control: Git installed and a repository set up (e.g., GitHub, GitLab).
- Monitoring Tool: Prometheus and Grafana installed (local or cloud-hosted).
- SLO Framework: OpenSLO or a similar tool for defining SLIs in YAML.
- Programming Knowledge: Basic understanding of YAML/JSON and scripting (e.g., Python, Bash).
- Cloud/Infra Access: Permissions to configure monitoring on your infrastructure.
Hands-On: Step-by-Step Beginner-Friendly Setup Guide
- Install Prometheus:
wget https://github.com/prometheus/prometheus/releases/download/v2.47.1/prometheus-2.47.1.linux-amd64.tar.gz
tar xvfz prometheus-2.47.1.linux-amd64.tar.gz
cd prometheus-2.47.1.linux-amd64
./prometheus --config.file=prometheus.yml
2. Set Up Grafana:
Install Grafana using Docker:
docker run -d -p 3000:3000 grafana/grafanaAccess Grafana at http://localhost:3000 (default login: admin/admin).
3. Define SLIs in OpenSLO:
Create a file sli.yaml:
apiVersion: openslo/v1
kind: SLI
metadata:
  name: api-latency
spec:
  description: Measures API response time
  thresholdMetric:
    metricSource:
      type: Prometheus
      metricQuery: histogram_quantile(0.95, sum(rate(http_request_duration_seconds_bucket[5m])) by (le))
    threshold: 0.5
4. Commit to Git:
git add sli.yaml
git commit -m "Add API latency SLI"
git push origin main
5. Configure Prometheus:
Update prometheus.yml:
scrape_configs:
  - job_name: 'api'
    static_configs:
      - targets: ['your-api:8080']
6. Set Up Grafana Dashboard:
- Add Prometheus as a data source in Grafana.
- Create a dashboard to visualize the
api-latencySLI using the Prometheus query.
Real-World Use Cases
Scenario 1: E-Commerce Platform
- Context: A retail website tracks checkout API availability.
- SLI as Code: Define availability as the percentage of HTTP 200 responses for
/checkoutendpoint. - Implementation: Use OpenSLO to define the SLI, monitored via Prometheus. Alerts trigger if availability drops below 99.9%.
- Outcome: Reduced checkout failures by 30% after optimizing load balancers based on SLI data.
Scenario 2: Ride-Hailing App
- Context: A ride-hailing service in Lagos monitors ride request latency.
- SLI as Code: Define latency as the 95th percentile of ride request confirmation times.
- Implementation: Codify the SLI in YAML, integrated with Google Cloud Operations Suite. Dashboards show real-time latency trends.
- Outcome: Improved user satisfaction by optimizing database queries during peak hours.
Scenario 3: Cloud Storage Provider
- Context: A cloud storage service ensures file retrieval speed.
- SLI as Code: Define SLI for file retrieval within 300ms for 99.95% of requests.
- Implementation: Use Prometheus and Grafana to monitor and visualize performance.
- Outcome: Identified bottlenecks in storage nodes, reducing retrieval times by 20%.
Scenario 4: Financial Services
- Context: A payment processing platform monitors transaction success rates.
- SLI as Code: Define SLI as the percentage of transactions completed within 2 seconds.
- Implementation: Automated alerts via PagerDuty for SLO breaches, with SLIs stored in Git.
- Outcome: Achieved 99.9% transaction success, improving customer trust.
Benefits & Limitations
Key Advantages
- Automation: Reduces manual configuration of monitoring systems.
- Version Control: Tracks changes to SLI definitions, ensuring auditability.
- Scalability: Easily extends to new services in microservices architectures.
- Alignment: Bridges technical metrics with business goals via SLOs.
Common Challenges or Limitations
- Complexity: Requires expertise in monitoring tools and YAML/JSON.
- Tooling Overhead: Initial setup of Prometheus, Grafana, or OpenSLO can be time-consuming.
- Maintenance: SLI definitions must evolve with system changes, requiring regular updates.
- False Positives: Poorly defined SLIs can trigger unnecessary alerts.
Best Practices & Recommendations
Security Tips
- Restrict access to SLI configuration files in Git using role-based access control.
- Encrypt sensitive metrics data in transit and at rest.
- Validate SLI configurations in CI/CD to prevent misconfigurations.
Performance
- Use efficient Prometheus queries to minimize resource usage.
- Aggregate SLIs at system boundaries to reduce monitoring overhead.
- Cache frequently accessed metrics to improve dashboard performance.
Maintenance
- Review SLI definitions quarterly to align with changing user needs.
- Document SLI rationale and SLO targets in code comments or wikis.
- Automate SLI validation using CI/CD pipelines.
Compliance Alignment
- Ensure SLIs align with regulatory requirements (e.g., GDPR for user data).
- Include audit trails for SLI changes in version control.
Automation Ideas
- Use scripts to auto-generate SLI configurations for new services.
- Integrate with Terraform to provision monitoring infrastructure alongside SLIs.
Comparison with Alternatives
| Approach | SLIs as Code | Manual SLI Configuration | Vendor-Specific Monitoring |
|---|---|---|---|
| Definition | SLIs defined in code (YAML/JSON) | Manual setup in monitoring tools | Predefined metrics in tools like AWS CloudWatch |
| Pros | Version-controlled, automated | Simple for small setups | Easy setup, vendor support |
| Cons | Requires tooling expertise | Error-prone, not scalable | Limited customization |
| Best Use Case | Large-scale, microservices | Small, single-service apps | Vendor-locked environments |
When to Choose SLIs as Code
- Choose SLIs as Code for complex, cloud-native systems with frequent updates, where automation and version control are critical.
- Choose Alternatives for small-scale projects or when using vendor-specific tools with limited customization needs.
Conclusion
SLIs as Code is a transformative approach in Site Reliability Engineering, enabling teams to automate and scale reliability monitoring. By codifying SLIs, SREs can align technical metrics with business goals, reduce toil, and improve system resilience. As cloud-native architectures and microservices continue to dominate, SLIs as Code will become increasingly vital. Future trends may include AI-driven SLI optimization and tighter integration with observability platforms.
Next Steps:
- Explore OpenSLO for standardizing SLI definitions: OpenSLO Docs.
- Join SRE communities like SREcon or Reddit r/sre.
- Experiment with Prometheus and Grafana for hands-on learning.