Introduction & Overview
Incident Response (IR) is a structured approach to identifying, managing, and mitigating disruptions in IT services to ensure system reliability and availability. In Site Reliability Engineering (SRE), IR is a cornerstone for maintaining service level objectives (SLOs) and ensuring operational continuity. This tutorial provides an in-depth guide to implementing Incident Response in an SRE context, covering its concepts, architecture, setup, use cases, and best practices.
What is Incident Response?
Incident Response is the process of detecting, responding to, and recovering from incidents—events that disrupt or threaten to disrupt normal service operations. In SRE, incidents range from server outages to application performance degradation.
- Key Objective: Minimize downtime, mitigate impact, and restore services swiftly.
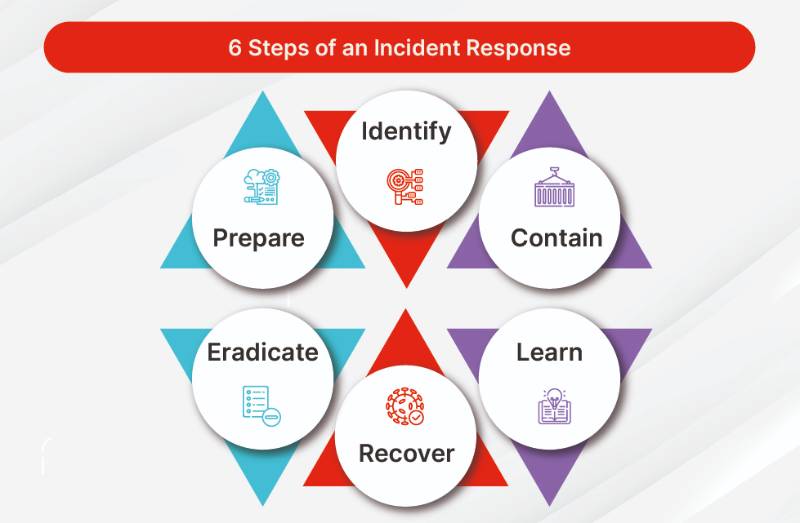
- Scope: Covers preparation, detection, containment, eradication, recovery, and post-incident analysis.
- SRE Alignment: Ensures systems meet reliability and performance goals, aligning with SLOs and service level agreements (SLAs).
History or Background
Incident Response originated in cybersecurity to address threats like malware and data breaches. Its adoption in SRE evolved with the rise of distributed systems and cloud computing, where system failures became more complex. Google’s SRE framework, introduced in the early 2000s, formalized IR as a disciplined process to handle large-scale system incidents.
- Evolution: From reactive firefighting to proactive, automated, and data-driven processes.
- Key Milestones: Development of tools like PagerDuty (2010), adoption of blameless postmortems, and integration with DevOps practices.
Why is it Relevant in Site Reliability Engineering?
SRE emphasizes reliability, scalability, and automation, making IR critical for:
- Uptime Guarantee: Ensures services meet SLOs (e.g., 99.9% availability).
- Customer Trust: Quick resolution maintains user confidence.
- Proactive Prevention: Post-incident analysis drives system improvements.
- Team Collaboration: Aligns cross-functional teams (developers, ops, security) during crises.
Core Concepts & Terminology
Key Terms and Definitions
| Term | Definition |
|---|---|
| Incident | An event causing disruption or potential disruption to service operations. |
| SLO | Service Level Objective; measurable target for service reliability (e.g., 99.9% uptime). |
| Blameless Postmortem | Analysis of an incident without attributing fault, focusing on improvement. |
| MTTR | Mean Time to Recovery; average time to restore service after an incident. |
| On-Call | SRE team members responsible for responding to incidents, often 24/7. |
| Runbook | Documented procedures for handling specific incidents or tasks. |
How It Fits into the SRE Lifecycle
Incident Response integrates into the SRE lifecycle as follows:
- Planning: Define SLOs, create runbooks, and set up monitoring.
- Monitoring: Detect anomalies using tools like Prometheus or Datadog.
- Response: Execute IR processes to contain and resolve incidents.
- Learning: Conduct postmortems to refine systems and prevent recurrence.
Architecture & How It Works
Components
The IR architecture in SRE comprises:
- Monitoring Systems: Tools like Prometheus, Grafana, or New Relic to detect anomalies.
- Alerting Tools: PagerDuty or Opsgenie to notify on-call engineers.
- Incident Management Platforms: ServiceNow or Jira for tracking and coordination.
- Communication Tools: Slack or Microsoft Teams for real-time collaboration.
- Automation Scripts: Runbooks or scripts for automated mitigation (e.g., restarting services).
- Logging Systems: ELK Stack or Splunk for post-incident analysis.
Internal Workflow
- Detection: Monitoring tools identify anomalies (e.g., high latency, error spikes).
- Alerting: Alerts are sent to on-call engineers via PagerDuty or email.
- Triage: Engineers assess severity and prioritize based on impact (e.g., Sev-1 for critical outages).
- Containment: Temporary fixes (e.g., rolling back a deployment) limit damage.
- Resolution: Root cause is addressed (e.g., patching a bug).
- Recovery: Services are restored, and performance is validated.
- Postmortem: Team documents findings, updates runbooks, and implements preventive measures.
Architecture Diagram
Description (as images cannot be generated):
The architecture diagram includes:
- Monitoring Layer: Prometheus/Grafana collecting metrics from application and infrastructure.
- Alerting Layer: PagerDuty receiving alerts and notifying on-call via SMS/email.
- Incident Management Layer: Jira tracking incident progress.
- Collaboration Layer: Slack channels for team communication.
- Automation Layer: Ansible scripts for automated recovery tasks.
- Logging Layer: ELK Stack storing logs for analysis.
Flow: Metrics flow from systems to monitoring, alerts to PagerDuty, incidents to Jira, and communication via Slack. Automation scripts execute predefined responses.
Integration Points with CI/CD or Cloud Tools
- CI/CD: Integrates with Jenkins or GitLab CI to roll back faulty deployments.
- Cloud Tools: AWS CloudWatch or Google Cloud Monitoring for cloud-native alerting.
- Orchestration: Kubernetes for auto-scaling or restarting failed pods.
- IaC: Terraform to rebuild infrastructure during recovery.
Installation & Getting Started
Basic Setup or Prerequisites
- Monitoring Tool: Install Prometheus and Grafana.
- Alerting Tool: Set up PagerDuty or Opsgenie account.
- Incident Management: Configure Jira or ServiceNow.
- Communication: Create dedicated Slack channels.
- Access: Ensure on-call team has admin access to systems.
- Runbooks: Document procedures in a shared repository (e.g., Confluence).
Hands-On: Step-by-Step Beginner-Friendly Setup Guide
This guide sets up a basic IR system using Prometheus, PagerDuty, and Slack.
Install Prometheus:
# Download and install Prometheus
wget https://github.com/prometheus/prometheus/releases/download/v2.45.0/prometheus-2.45.0.linux-amd64.tar.gz
tar xvfz prometheus-2.45.0.linux-amd64.tar.gz
cd prometheus-2.45.0.linux-amd64
./prometheus --config.file=prometheus.yml
Configure prometheus.yml:
global:
  scrape_interval: 15s
scrape_configs:
  - job_name: 'myapp'
    static_configs:
      - targets: ['localhost:9090']
2. Set Up PagerDuty:
- Create a PagerDuty account and add a service.Generate an API key and configure it in Prometheus Alertmanager:
receivers: - name: 'pagerduty' pagerduty_configs: - service_key: <your_pagerduty_api_key>
3. Configure Slack Notifications:
receivers:
  - name: 'slack'
    slack_configs:
      - api_url: 'https://hooks.slack.com/services/xxx/yyy/zzz'
        channel: '#incidents'
4. Test the Setup:
Simulate an incident by stopping a service.
Verify PagerDuty and Slack notifications are triggered.
Real-World Use Cases
- E-Commerce Platform Outage:
- Scenario: A payment gateway fails during a peak sale, impacting revenue.
- IR Application: Monitoring detects error spikes, PagerDuty alerts the team, and a runbook rolls back the faulty deployment. Postmortem identifies a misconfigured API rate limit.
- Industry: Retail.
- Cloud Service Downtime:
- Scenario: An AWS RDS database becomes unresponsive, affecting a SaaS application.
- IR Application: CloudWatch triggers an alert, the team scales up the database instance, and a postmortem leads to automated failover scripts.
- Industry: SaaS.
- API Latency Spike:
- Scenario: A microservice API experiences high latency, slowing user requests.
- IR Application: Grafana identifies the issue, the team throttles traffic, and analysis reveals a memory leak in the code.
- Industry: FinTech.
- Security Incident:
- Scenario: A DDoS attack targets a public-facing service.
- IR Application: WAF (Web Application Firewall) mitigates the attack, alerts notify the team, and a postmortem strengthens rate-limiting rules.
- Industry: Cybersecurity.
Benefits & Limitations
Key Advantages
- Reduced Downtime: Fast detection and resolution minimize service disruptions.
- Improved Collaboration: Structured processes align cross-functional teams.
- Continuous Improvement: Postmortems drive system reliability enhancements.
- Automation: Runbooks and scripts reduce manual intervention.
Common Challenges or Limitations
- Alert Fatigue: Too many alerts overwhelm on-call teams.
- Complex Setup: Integrating tools like Prometheus and PagerDuty requires expertise.
- False Positives: Poorly configured monitoring can trigger unnecessary alerts.
- Cost: Tools like PagerDuty and Splunk have licensing fees.
Best Practices & Recommendations
Security Tips
- Restrict access to IR tools to authorized personnel.
- Encrypt communication channels (e.g., Slack webhooks).
- Regularly audit runbooks for outdated procedures.
Performance
- Tune monitoring thresholds to reduce false positives.
- Use distributed tracing (e.g., Jaeger) for complex systems.
- Prioritize high-impact incidents (Sev-1) over minor issues.
Maintenance
- Update runbooks quarterly to reflect system changes.
- Conduct regular IR drills to train teams.
- Monitor tool health (e.g., Prometheus uptime).
Compliance Alignment
- Align with standards like ISO 27001 for security incidents.
- Document all IR actions for audit trails.
- Ensure GDPR compliance for data breaches.
Automation Ideas
- Automate rollbacks using CI/CD pipelines.
- Use AI-driven anomaly detection (e.g., AWS X-Ray).
- Implement chatops for Slack-based incident commands.
Comparison with Alternatives
| Feature | Incident Response (SRE) | Traditional IT Helpdesk | Chaos Engineering |
|---|---|---|---|
| Focus | Proactive, system-wide | Reactive, user-focused | Proactive, resilience testing |
| Tools | Prometheus, PagerDuty | ServiceNow, Zendesk | Chaos Monkey |
| Automation | High (runbooks, scripts) | Low to medium | High (controlled failures) |
| Use Case | System outages, latency | User issues, tickets | Preemptive failure testing |
| SRE Fit | Core to reliability | Limited integration | Complementary |
When to Choose Incident Response
- Use IR for critical systems requiring high availability.
- Prefer alternatives like Chaos Engineering for resilience testing or IT helpdesk for user-facing issues.
Conclusion
Incident Response is a vital discipline in SRE, ensuring systems remain reliable and performant. By integrating monitoring, alerting, and automation, SRE teams can minimize downtime and improve service quality. Future trends include AI-driven incident prediction and increased automation via chatops. To deepen your knowledge, explore official documentation and communities:
- Official Docs: PagerDuty, Prometheus, SRE Book by Google
- Communities: SRE Slack, Reddit r/sre, LinkedIn SRE groups