Introduction & Overview
What is a Zombie Process/Service?
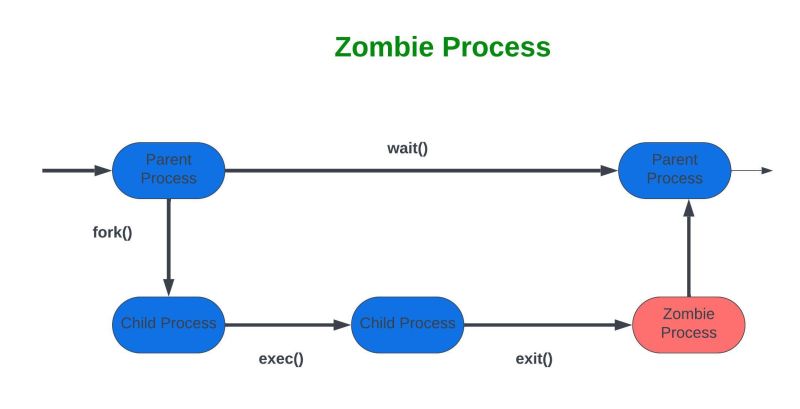
In the context of Site Reliability Engineering (SRE), a zombie process or zombie service refers to a process or service that has completed its execution but still lingers in the system’s process table, consuming resources or causing potential reliability issues. A zombie process typically occurs in Unix-like systems when a child process terminates, but its parent process has not yet retrieved its exit status, leaving it in a “defunct” state. In a broader SRE context, a “zombie service” can metaphorically describe microservices or containerized applications that are no longer functional but remain active, consuming resources or causing errors in distributed systems.
This tutorial focuses on zombie processes and services as they relate to SRE, emphasizing their identification, monitoring, and mitigation to ensure system reliability, scalability, and performance.
History or Background
The concept of zombie processes originates from Unix operating systems, where processes are managed in a parent-child hierarchy. When a process terminates, it enters a zombie state until its parent process reads its exit status via a system call like wait(). If the parent fails to do so, the process remains a zombie, leading to resource leaks. In modern cloud-native environments, zombie services can also refer to orphaned containers, pods, or microservices that fail to terminate cleanly due to misconfigurations, bugs, or improper orchestration.
Zombie processes and services have become increasingly relevant in SRE as systems scale to thousands of containers and microservices, managed by orchestration platforms like Kubernetes. The term “zombie code” (unused code in applications) also relates to this concept, as it contributes to technical debt and potential reliability issues, which SRE teams aim to mitigate.
Why is it Relevant in Site Reliability Engineering?
Zombie processes and services pose significant challenges in SRE:
- Resource Waste: They consume memory, CPU, or network resources, impacting system performance and scalability.
- Reliability Risks: Zombies can lead to cascading failures, especially in distributed systems where orphaned services disrupt communication.
- Monitoring Complexity: Detecting and managing zombies requires robust observability practices, a core SRE principle.
- Automation Needs: SRE emphasizes automation to reduce toil (manual, repetitive tasks). Zombie processes/services often require automated detection and cleanup to maintain system health.
By addressing zombie processes/services, SREs ensure systems meet Service Level Objectives (SLOs) for availability, latency, and performance, aligning with the principles of reliability engineering outlined by Google and other industry leaders.
Core Concepts & Terminology
Key Terms and Definitions
- Zombie Process: A process that has terminated but remains in the process table because its parent has not retrieved its exit status. Identified in Unix systems with a
<defunct>tag inpsoutput. - Zombie Service: An extension of the zombie process concept, referring to containerized services, pods, or microservices that are non-functional but still running, often due to orchestration or configuration issues.
- Service Level Indicators (SLIs): Metrics like process count, memory usage, or service availability used to measure system health.
- Service Level Objectives (SLOs): Target values for SLIs, defining acceptable reliability levels.
- Error Budget: The acceptable amount of downtime or errors within a period, balancing reliability and innovation.
- Toil: Manual, repetitive tasks that SREs aim to automate, such as manually killing zombie processes.
- Observability: The ability to monitor and understand system behavior using tools like Prometheus, Grafana, or Kubernetes.
| Term | Definition | Example |
|---|---|---|
| Zombie Process | A defunct process in Unix/Linux that has finished execution but remains in the process table. | `ps aux |
| Zombie Service | A service that consumes resources but provides no useful output. | Old API instance still running post-deployment |
| Orphaned Service | Similar to zombie, but specifically detached from parent orchestration. | Docker container left behind after crash |
| SLO Impact | Effect of zombie services on Service Level Objectives. | Latency increases due to wasted resources |
| Observability Gap | Monitoring tools track a service, but it doesn’t serve traffic. | Prometheus still scraping unused pods |
How It Fits into the Site Reliability Engineering Lifecycle
Zombie processes/services impact multiple stages of the SRE lifecycle:
- Design and Development: Poorly designed applications or microservices can lead to zombie processes due to improper process handling or resource cleanup.
- Deployment: Misconfigured CI/CD pipelines or container orchestrators (e.g., Kubernetes) can leave zombie services running.
- Monitoring and Observability: SREs use monitoring tools to detect zombies through metrics like process counts or resource usage anomalies.
- Incident Response: Zombies may trigger alerts or incidents, requiring root cause analysis and resolution.
- Postmortems: Blameless postmortems help identify why zombies occur and how to prevent them through automation or better design.
Architecture & How It Works
Components and Internal Workflow
Managing zombie processes/services in SRE involves several components:
- Operating System: Manages processes and their states (e.g., running, terminated, zombie).
- Orchestration Platform: Tools like Kubernetes manage containerized services, where zombie services may arise due to pod termination failures.
- Monitoring Tools: Prometheus, Grafana, or Nagios collect metrics to detect zombies (e.g., high process counts or defunct processes).
- Automation Scripts: Scripts or tools (e.g., shell scripts, Ansible) to kill or clean up zombies.
- Alerting Systems: Notify SREs when zombie-related thresholds (e.g., process count) are breached.
Workflow:
- A process or service terminates but fails to clean up properly (e.g., parent process doesn’t call
wait()or a pod fails to terminate). - The zombie process/service remains in the system, consuming resources.
- Monitoring tools detect anomalies (e.g., increased defunct processes or orphaned pods).
- Alerts are triggered based on predefined SLIs/SLOs.
- Automation scripts or manual intervention resolve the zombie state (e.g., killing the process or restarting the service).
- Postmortems analyze root causes and implement preventive measures.
Architecture Diagram
Description (since image generation is not possible):
The architecture diagram would depict a layered system:
- Top Layer (Monitoring): Prometheus and Grafana dashboards showing process counts, memory usage, and pod statuses.
- Middle Layer (Orchestration): Kubernetes cluster with nodes, pods, and containers, some marked as “zombie” due to termination failures.
- Bottom Layer (OS): Linux kernel managing processes, with some in
<defunct>state. - Connectors: Arrows showing data flow from OS to monitoring tools (via metrics exporters) and automation scripts interacting with Kubernetes and the OS to resolve zombies.
- Alerting Path: Alerts flowing from monitoring tools to an incident management system (e.g., PagerDuty).
   ┌───────────────────┐        ┌───────────────────┐
   │   CI/CD Pipeline   │──────▶│ Active Services    │
   └───────────────────┘        └───────────────────┘
              │                           │
              │  Deploys New Version      │
              ▼                           ▼
   ┌───────────────────┐        ┌───────────────────┐
   │ Zombie Detector    │◀─────▶│ Zombie Services   │
   └───────────────────┘        └───────────────────┘
              │                           │
              ▼                           ▼
   ┌───────────────────┐        ┌───────────────────┐
   │ Alerting System    │──────▶│ SRE Team          │
   └───────────────────┘        └───────────────────┘
              │
              ▼
   ┌───────────────────┐
   │ Auto-Cleanup Tool  │
   └───────────────────┘
Integration Points with CI/CD or Cloud Tools
- CI/CD Pipelines: Integrate zombie detection into build tests to ensure new deployments don’t introduce zombie-prone code.
- Kubernetes: Use liveness/readiness probes to detect and restart zombie services.
- Cloud Monitoring: AWS CloudWatch or Google Cloud Monitoring to track zombie-related metrics.
- Ansible/Terraform: Automate cleanup of zombie processes/services as part of infrastructure as code (IaC).
Installation & Getting Started
Basic Setup or Prerequisites
To manage zombie processes/services in an SRE environment, you need:
- Operating System: Linux-based system (e.g., Ubuntu, CentOS).
- Monitoring Tools: Prometheus and Grafana for observability.
- Orchestration: Kubernetes for containerized environments.
- Scripting Tools: Bash, Python, or Ansible for automation.
- Permissions: Root or sudo access to manage processes.
- Network Access: For monitoring and alerting integrations.
Hands-on: Step-by-Step Beginner-Friendly Setup Guide
This guide sets up a basic system to detect and manage zombie processes on a Linux server.
- Install Prometheus and Grafana:
# Install Prometheus
wget https://github.com/prometheus/prometheus/releases/download/v2.47.0/prometheus-2.47.0.linux-amd64.tar.gz
tar xvfz prometheus-2.47.0.linux-amd64.tar.gz
cd prometheus-2.47.0.linux-amd64
./prometheus --config.file=prometheus.yml &

# Install Grafana
sudo apt-get install -y adduser libfontconfig1
wget https://dl.grafana.com/oss/release/grafana_9.5.3_amd64.deb
sudo dpkg -i grafana_9.5.3_amd64.deb
sudo systemctl start grafana-server
2. Configure Prometheus to Monitor Processes:
Edit prometheus.yml to include a node exporter for process metrics:
scrape_configs:
  - job_name: 'node'
    static_configs:
      - targets: ['localhost:9100']
Install node exporter:
wget https://github.com/prometheus/node_exporter/releases/download/v1.6.1/node_exporter-1.6.1.linux-amd64.tar.gz
tar xvfz node_exporter-1.6.1.linux-amd64.tar.gz
cd node_exporter-1.6.1.linux-amd64
./node_exporter &
3. Set Up Grafana Dashboard:
- Access Grafana at
http://localhost:3000(default login: admin/admin). - Add Prometheus as a data source.
- Import a dashboard (e.g., ID 1860) to visualize process metrics, including zombie process counts.
4. Create a Script to Detect and Kill Zombie Processes:
#!/bin/bash
# File: cleanup_zombies.sh
ZOMBIES=$(ps aux | grep '<defunct>' | awk '{print $2}')
if [ -n "$ZOMBIES" ]; then
    for PID in $ZOMBIES; do
        echo "Killing zombie process $PID"
        kill -9 $PID
    done
else
    echo "No zombie processes found"
fi
Make it executable:
chmod +x cleanup_zombies.sh5. Automate Cleanup with Cron:
Add to crontab to run every 10 minutes:
crontab -e
*/10 * * * * /path/to/cleanup_zombies.sh
6. Test the Setup:
Simulate a zombie process:
(sleep 1 & ) # Creates a child process that terminates but may become a zombie
ps aux | grep '<defunct>'
Check Grafana for zombie process metrics and verify the script kills them.
Real-World Use Cases
- E-commerce Platform:
- Scenario: An e-commerce platform uses Kubernetes to manage microservices. A payment service pod fails to terminate properly after an update, becoming a zombie and causing delayed transactions.
- SRE Application: Use Kubernetes liveness probes and Prometheus to detect the zombie pod. Automate pod restart and log the incident for postmortem analysis.
- Industry Context: Retail, where downtime directly impacts revenue.
- Streaming Service:
- Scenario: A video streaming service has a defunct encoding process consuming CPU, leading to latency in video delivery.
- SRE Application: Monitor CPU usage with Grafana, identify the zombie process, and use an automated script to kill it. Update the encoding application to handle process cleanup better.
- Industry Context: Media, where latency affects user experience.
- Financial Application:
- Scenario: A trading platform’s microservice fails to shut down after a configuration change, causing resource exhaustion and trade delays.
- SRE Application: Implement error budgets to limit zombie service impact. Use Ansible to automate service cleanup and enforce SLOs for availability.
- Industry Context: Finance, where reliability is critical for compliance and trust.
- Cloud-Native SaaS:
- Scenario: A SaaS application on AWS has orphaned ECS tasks (zombie services) due to misconfigured task definitions.
- SRE Application: Use AWS CloudWatch to monitor task states, automate termination of orphaned tasks, and conduct chaos engineering to test resilience against zombies.
- Industry Context: SaaS, where scalability is key.
Benefits & Limitations
Key Advantages
- Improved Reliability: Detecting and resolving zombies ensures systems meet SLOs for availability and performance.
- Resource Efficiency: Cleaning up zombies frees CPU, memory, and network resources, optimizing costs.
- Automation: Automating zombie detection and cleanup reduces toil, aligning with SRE principles.
- Proactive Management: Early detection prevents cascading failures in distributed systems.
Common Challenges or Limitations
| Challenge | Description | Mitigation |
|---|---|---|
| Detection Complexity | Zombies may not always trigger clear alerts, especially in large systems. | Use comprehensive observability tools like Prometheus and Grafana. |
| Root Cause Analysis | Identifying why a process/service becomes a zombie can be time-consuming. | Conduct blameless postmortems and improve application design. |
| Automation Risks | Aggressive cleanup scripts may kill legitimate processes. | Test scripts in staging environments and use canary deployments. |
| Scalability | Manual cleanup doesn’t scale in large systems with thousands of processes. | Leverage orchestration tools like Kubernetes for automated scaling. |
Best Practices & Recommendations
- Security Tips:
- Restrict cleanup script permissions to prevent unauthorized process termination.
- Monitor for zombie processes that may indicate security breaches (e.g., malware).
- Performance:
- Use lightweight monitoring tools to avoid overhead in zombie detection.
- Optimize parent process code to call
wait()or equivalent promptly.
- Maintenance:
- Regularly review monitoring dashboards for zombie trends.
- Update CI/CD pipelines to test for zombie-prone code during deployment.
- Compliance Alignment:
- Document zombie incidents to comply with audit requirements in regulated industries (e.g., finance).
- Ensure cleanup scripts log actions for traceability.
- Automation Ideas:
Comparison with Alternatives
| Feature | Zombie Process/Service Management | Traditional SysAdmin Approach | Chaos Engineering |
|---|---|---|---|
| Focus | Automate detection and cleanup of zombies to ensure reliability. | Manual process monitoring and termination. | Simulate failures to test resilience. |
| Tools | Prometheus, Grafana, Kubernetes, Ansible. | Manual ps, kill commands. | Chaos Monkey, Gremlin. |
| Scalability | Scales with automation and orchestration. | Limited scalability due to manual effort. | Scales for testing but not cleanup. |
| Toil Reduction | High (automated cleanup). | Low (high manual effort). | Moderate (focus on testing). |
| When to Use | Large-scale, cloud-native systems with frequent deployments. | Small systems with minimal automation. | Proactive resilience testing. |
When to Choose Zombie Management:
- Use when managing large-scale, distributed systems where zombies can impact SLOs.
- Prefer over manual sysadmin approaches for scalability and toil reduction.
- Complement with chaos engineering to prevent zombie scenarios proactively.
Conclusion
Managing zombie processes and services is a critical aspect of Site Reliability Engineering, ensuring systems remain reliable, scalable, and efficient. By leveraging automation, observability, and best practices, SREs can mitigate the risks posed by zombies, aligning with core SRE principles like reducing toil and maintaining SLOs. As systems grow in complexity, the need for robust zombie management will increase, driven by trends like microservices and cloud-native architectures.
Next Steps:
- Explore advanced monitoring with tools like Prometheus and Grafana.
- Implement chaos engineering to test system resilience against zombies.
- Join SRE communities for knowledge sharing.
Resources:
- Google SRE Book: https://sre.google/sre-book/table-of-contents/[](https://sre.google/books/)
- Prometheus Documentation: https://prometheus.io/docs/
- Kubernetes Documentation: https://kubernetes.io/docs/
- SRE Community: https://www.reddit.com/r/sre/