1. Introduction & Overview
What is Observability?
Observability is a system’s ability to provide insight into its internal state based on the data it produces—like logs, metrics, traces, and events. In DevSecOps, observability extends beyond system health to include security posture, compliance events, and anomalous behaviors across the software development lifecycle.
History or Background
- Origin: The term “observability” comes from control theory (1960s) — it describes how well internal states of a system can be inferred from knowledge of its outputs.
- Evolution:
- Traditional monitoring focused on what happened.
- Observability helps understand why it happened, particularly in complex distributed environments like microservices, Kubernetes, and cloud-native stacks.
Why Is It Relevant in DevSecOps?
- Enables early detection of security incidents.
- Enhances resilience and rapid recovery.
- Ensures auditability and compliance.
- Provides a unified view across development, operations, and security.
2. Core Concepts & Terminology
Key Terms and Definitions
| Term | Definition |
|---|---|
| Logs | Time-stamped text records of events from applications or infrastructure. |
| Metrics | Numerical measurements (e.g., CPU usage, HTTP latency) over time. |
| Traces | Show the path of a request through various services/components. |
| Events | Security or system-related signals like login attempts or container restarts. |
| Telemetry | Collective term for all data generated (logs, metrics, traces, events). |
How It Fits into the DevSecOps Lifecycle
| DevSecOps Phase | Observability Role |
|---|---|
| Plan | Identify critical security & performance KPIs. |
| Develop | Instrument code for traceability and logging. |
| Build/Test | Monitor test coverage, SCA vulnerabilities, build performance. |
| Release | Validate deployment health, regression indicators. |
| Operate | Real-time insights into app behavior, compliance events. |
| Monitor | Detect anomalies, intrusion attempts, and drift. |
| Respond | Facilitate incident forensics and RCA (Root Cause Analysis). |
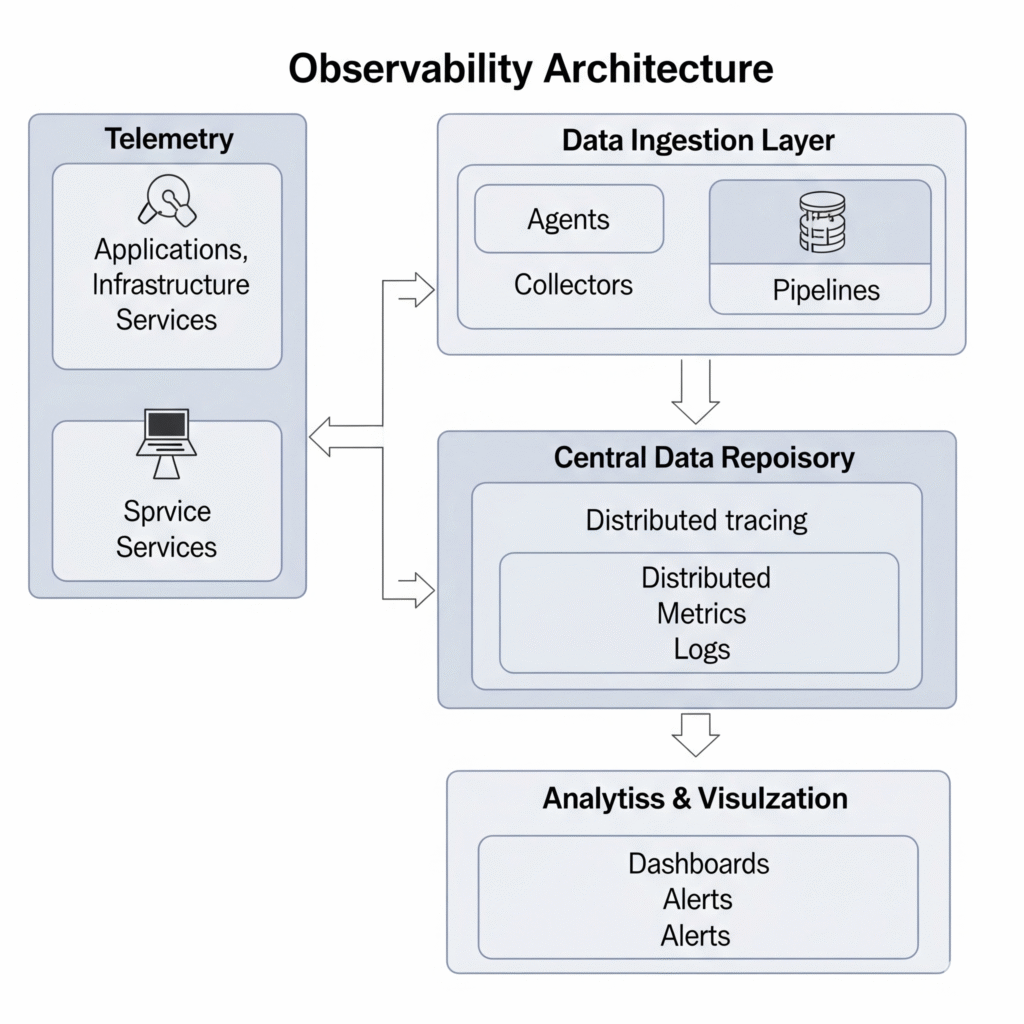
3. Architecture & How It Works
Components
- Instrumentation Layer
- Code or libraries emitting logs, metrics, and traces (e.g., OpenTelemetry SDKs).
- Data Collection Agent
- Agents like Fluent Bit, Prometheus Node Exporter, or Datadog Agent.
- Data Pipeline
- Middleware to process and enrich data (e.g., Kafka, Fluentd).
- Storage Backend
- Time-series databases, log stores, or tracing backends (e.g., Prometheus, Loki, Elasticsearch).
- Visualization & Alerting
- Dashboards and alerting systems (e.g., Grafana, Kibana, Alertmanager).
- Security Correlation Engine
- Detects threats from observability data (e.g., Falco, SIEM platforms).
Internal Workflow (Described)
- Instrumentation → Application emits telemetry.
- Collection → Agents collect and forward data.
- Processing → Data is enriched, filtered, normalized.
- Storage → Data is persisted in appropriate formats.
- Analysis & Alerting → Dashboards provide insights, alerts are triggered on anomalies.
Architecture Diagram (Descriptive)
+----------------+         +----------------+        +----------------+
|  Application   | ----->  |  Telemetry     | -----> | Data Pipeline  |
|  (w/ SDKs)     |         |  Agent (e.g.,  |        | (e.g., Fluentd)|
|                |         | OpenTelemetry) |        |                |
+----------------+         +----------------+        +----------------+
                                                         |
                                                         v
                                                  +--------------+
                                                  | Storage & DB |
                                                  | (e.g., Loki, |
                                                  | Prometheus)  |
                                                  +--------------+
                                                         |
                                                         v
                                              +---------------------+
                                              | Dashboards / Alerts |
                                              | (Grafana, Kibana)   |
                                              +---------------------+
Integration with CI/CD and Cloud
| Tool | Integration Example |
|---|---|
| Jenkins/GitHub Actions | Emit pipeline metrics and logs |
| AWS/GCP/Azure | CloudWatch, Stackdriver, Azure Monitor |
| Kubernetes | Metrics Server, kube-state-metrics, Falco |
| Security Tools | Integrate DAST/SAST logs for incident correlation |
4. Installation & Getting Started
Basic Prerequisites
- Containerized environment (Docker/Kubernetes)
- Basic knowledge of Prometheus + Grafana
- Admin rights on system or cloud provider
Step-by-Step: Minimal Observability Stack with Prometheus + Grafana
# 1. Create docker-compose.yml
version: '3'
services:
  prometheus:
    image: prom/prometheus
    ports:
      - "9090:9090"
    volumes:
      - ./prometheus.yml:/etc/prometheus/prometheus.yml

  grafana:
    image: grafana/grafana
    ports:
      - "3000:3000"

# 2. prometheus.yml (configure targets)
global:
  scrape_interval: 15s
scrape_configs:
  - job_name: 'node'
    static_configs:
      - targets: ['localhost:9100']
# 3. Start services
docker-compose up -d

# 4. Visit Prometheus at http://localhost:9090
#    Visit Grafana at http://localhost:3000 (default login: admin/admin)
Kubernetes Setup (Basic)
- Install kube-prometheus-stack using Helm:
helm repo add prometheus-community https://prometheus-community.github.io/helm-charts
helm install kps prometheus-community/kube-prometheus-stack
5. Real-World Use Cases
1. Container Security Monitoring
- Use Falco with Prometheus to detect suspicious activities like shell execs in containers.
- Alerts visualized via Grafana.
2. Pipeline Audit and SLA Monitoring
- Integrate CI/CD tools (e.g., Jenkins, GitLab) to export build metrics.
- Measure MTTR (Mean Time to Recovery), build success rates.
3. Cloud Infrastructure Compliance
- Use CloudTrail + OpenSearch for tracking API activity.
- Observability reveals drift, privilege escalation, failed logins.
4. Microservices Traceability
- Combine OpenTelemetry + Jaeger to trace requests across services.
- Useful during incident response or performance bottlenecks.
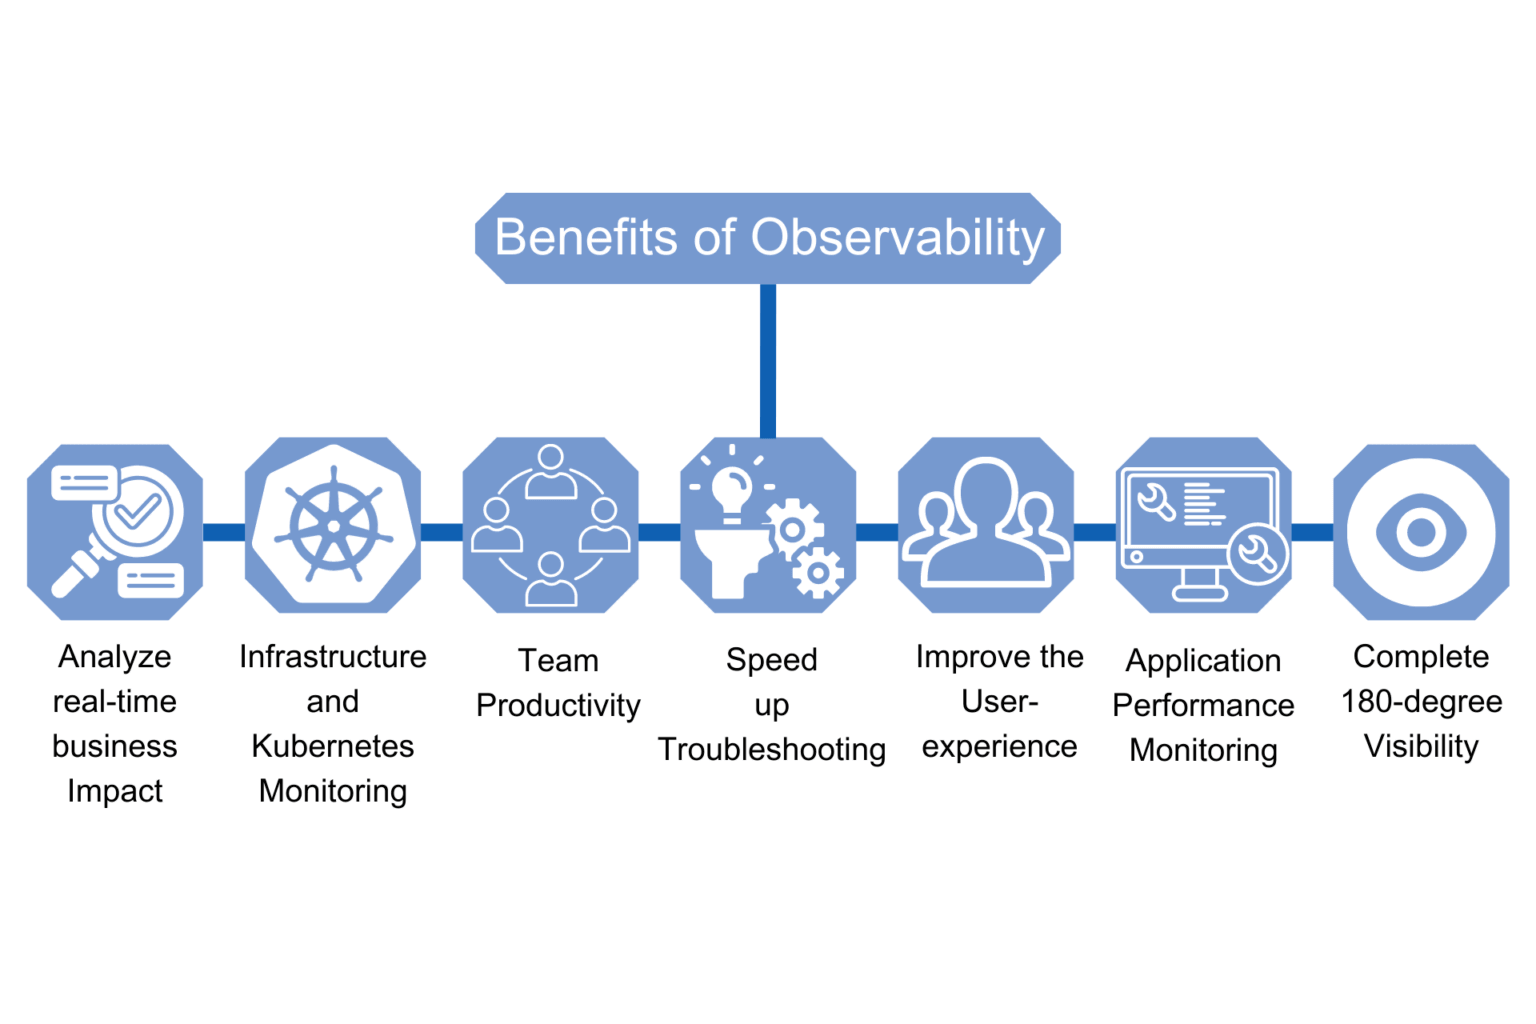
6. Benefits & Limitations
Key Advantages
- Improved MTTR through faster root cause analysis
- Proactive Security by detecting anomalies early
- Auditability for compliance and forensic analysis
- Cross-Team Collaboration with shared insights
Common Challenges
- Data Overload: High telemetry volume without proper filtering
- Cost: Storing logs and traces can be expensive
- Alert Fatigue: Poorly configured alerts cause noise
- Skills Gap: Requires knowledge in observability tools + domain context
7. Best Practices & Recommendations
Security Tips
- Scrub sensitive data in logs (e.g., API keys, PII)
- Enable RBAC on dashboards and alert systems
- Use TLS and authentication for data transport
Performance & Maintenance
- Limit data retention where possible
- Use sampling for traces (e.g., 10% of traffic)
- Monitor your observability platform itself
Compliance & Automation
- Automate alerts for non-compliance (e.g., PCI, HIPAA)
- Integrate observability checks in CI/CD pipelines
8. Comparison with Alternatives
| Tool/Approach | Observability Stack | Traditional Monitoring | SIEM |
|---|---|---|---|
| Focus | Application + Security insights | Infrastructure health | Security event management |
| Data Types | Logs, Metrics, Traces, Events | Metrics | Logs & Events |
| DevSecOps Fit | High | Medium | High |
| Flexibility | Highly customizable | Less flexible | Varies |
When to Choose Observability?
- Use observability when:
- You have complex, distributed systems
- You need real-time security insights
- You’re practicing DevSecOps at scale
9. Conclusion
Observability is essential in modern DevSecOps pipelines to ensure systems are not just available but also secure, compliant, and resilient. By embedding observability into every phase, teams can anticipate failures, detect intrusions, and respond with agility.
Next Steps
- Deploy a full observability stack in your test environment.
- Align observability metrics with risk management and compliance goals.
- Explore OpenTelemetry as a unified instrumentation standard.