Introduction & Overview
Site Reliability Engineering (SRE) is a discipline that blends software engineering with IT operations to build and maintain scalable, reliable systems. Reliability, a cornerstone of SRE, ensures systems perform consistently under expected conditions, minimizing downtime and enhancing user experience. This tutorial provides an in-depth exploration of reliability within SRE, covering its principles, implementation, and practical applications. Designed for technical readers, it includes architecture diagrams, code snippets, and tables to clarify concepts.
What is Reliability?
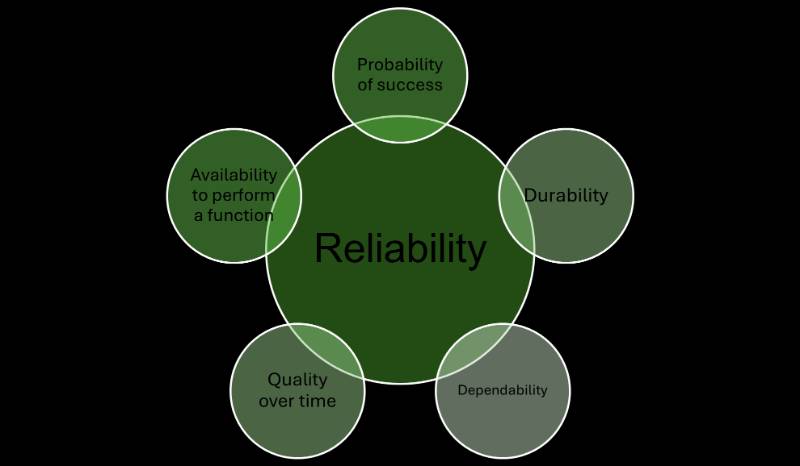
Reliability in SRE refers to a system’s ability to perform its intended function without failure under specified conditions for a defined period. It’s quantified as the probability of success, often measured through metrics like uptime, availability, and mean time between failures (MTBF). In SRE, reliability extends beyond hardware to encompass software systems, focusing on automation, observability, and incident management to maintain service quality.
History or Background
The concept of reliability engineering originated in the 1940s with the U.S. military, emphasizing equipment performance during World War II. It evolved through statistical process control in the 1920s by Walter A. Shewhart and fatigue modeling by Waloddi Weibull. SRE, pioneered by Google in 2003 by Benjamin Treynor Sloss, adapted reliability engineering to software systems, integrating automation and software development practices to address modern challenges like scalability and rapid deployment cycles.
Why is it Relevant in Site Reliability Engineering?
Reliability is critical in SRE because:
- User Expectations: Modern users demand near-constant availability (e.g., 99.9% uptime for e-commerce platforms).
- Business Impact: Downtime can lead to revenue loss, as seen in outages costing companies like Amazon millions per minute.
- Scalability: Reliable systems handle traffic spikes without degradation.
- Automation: SRE emphasizes automation to reduce human error, enhancing reliability.
Core Concepts & Terminology
Key Terms and Definitions
| Term | Definition |
|---|---|
| Availability | The percentage of time a system is operational and accessible. |
| Service Level Indicator (SLI) | Measurable metrics (e.g., latency, error rate) reflecting system performance. |
| Service Level Objective (SLO) | Target values for SLIs (e.g., 99.95% uptime) guiding reliability goals. |
| Service Level Agreement (SLA) | Contractual uptime/performance guarantees with penalties for breaches. |
| Error Budget | Acceptable level of unreliability, balancing innovation and stability. |
| Toil | Repetitive, manual tasks that SRE aims to automate to improve reliability. |
| Mean Time to Recovery (MTTR) | Average time to restore service after a failure. |
| Reliability Block Diagram (RBD) | Graphical representation of system components and their reliability impact. |
How It Fits into the Site Reliability Engineering Lifecycle
Reliability is embedded across the SRE lifecycle:
- Design: Incorporate redundancy and fault tolerance (e.g., active-active architecture).
- Development: Use automation for deployments to reduce errors.
- Monitoring: Implement observability (logs, metrics, traces) to detect issues proactively.
- Incident Response: Conduct blameless postmortems to learn from failures.
- Continuous Improvement: Refine SLOs and reduce toil through automation.
Architecture & How It Works
Components and Internal Workflow
Reliability in SRE relies on:
- Monitoring Systems: Tools like Prometheus and Grafana collect real-time metrics (e.g., latency, error rates).
- Alerting Systems: Notify engineers when SLIs breach SLO thresholds.
- Automation Tools: Scripts or platforms (e.g., Ansible, Terraform) automate provisioning and recovery.
- Incident Management: Structured processes for rapid response, including on-call rotations.
- Observability: Combines logs, metrics, and traces for deep system insights.
Workflow:
- Define SLIs/SLOs based on user needs (e.g., 99.95% availability).
- Monitor system health using tools to track SLIs.
- Trigger alerts for anomalies, prioritizing critical issues.
- Automate recovery (e.g., auto-scaling during traffic spikes).
- Analyze incidents via postmortems to improve future reliability.
Architecture Diagram Description
The architecture for reliability in SRE can be visualized as follows (text-based due to format constraints):
[Users] –> [Load Balancer] –> [Application Cluster (Active-Active)]
|–> [Monitoring: Prometheus/Grafana]
|–> [Alerting: PagerDuty]
|–> [Automation: Terraform/Ansible]
|–> [Logging: ELK Stack]
|–> [Database: Replicated SQL/NoSQL]
- Load Balancer: Distributes traffic to prevent overload.
- Application Cluster: Redundant nodes ensure availability.
- Monitoring/Alerting: Tracks SLIs and notifies on breaches.
- Automation: Manages scaling and recovery.
- Logging: Stores event data for analysis.
- Database: Replicated for fault tolerance.
Integration Points with CI/CD or Cloud Tools
- CI/CD: Reliability integrates with CI/CD pipelines (e.g., Jenkins, GitLab CI) to automate testing and deployments, reducing human error. Canary releases test updates on a small user subset to ensure stability.
- Cloud Tools: AWS Auto Scaling, Google Cloud Monitoring, or Azure Monitor enhance reliability by providing scalable infrastructure and observability. Kubernetes integrates for container orchestration, ensuring fault tolerance.
Installation & Getting Started
Basic Setup or Prerequisites
To implement reliability practices in SRE:
- Skills: Proficiency in programming (e.g., Python, Go), system architecture, and cloud platforms.
- Tools: Install Prometheus, Grafana, Terraform, and a logging solution (e.g., ELK Stack).
- Environment: Access to a cloud provider (AWS, GCP, Azure) or local servers.
- Access: Permissions to configure monitoring and automation tools.
Hands-On: Step-by-Step Beginner-Friendly Setup Guide
This guide sets up a basic monitoring system with Prometheus and Grafana for reliability tracking.
- Install Prometheus:
- Download from
https://prometheus.io/download/. - Extract and configure
prometheus.yml:
- Download from
global:
  scrape_interval: 15s
scrape_configs:
  - job_name: 'my-app'
    static_configs:
      - targets: ['localhost:8080']
Run Prometheus:
./prometheus --config.file=prometheus.yml2. Install Grafana:
- Download from
https://grafana.com/grafana/download. - Start Grafana:
./grafana-server- Access Grafana at
http://localhost:3000, log in (default: admin/admin).
3. Configure Data Source:
- In Grafana, add Prometheus as a data source (
http://localhost:9090). - Create a dashboard to visualize metrics (e.g., HTTP request latency).
4. Set Up Alerts:
- In Prometheus, define an alert rule in
prometheus.yml:
rule_files:
- 'alert.rules.yml'- Create
alert.rules.yml:
groups:
- name: example
  rules:
  - alert: HighErrorRate
    expr: rate(http_requests_total{status="500"}[5m]) > 0.01
    for: 5m
    labels:
      severity: critical
    annotations:
summary: "High error rate detected"- Integrate with PagerDuty for notifications.
5. Test the Setup:
- Simulate a failure (e.g., stop your application) and verify alerts in Grafana/PagerDuty.
Real-World Use Cases
Scenario 1: E-Commerce Platform
A retail platform sets an SLO of 99.9% uptime for its product catalog. During Black Friday, traffic spikes cause latency issues. The SRE team uses Prometheus to monitor SLIs, auto-scales with AWS, and reroutes traffic via a load balancer, maintaining reliability. Post-event, a postmortem identifies database bottlenecks, leading to query optimizations.
Scenario 2: Financial Services
BetaBank faced frequent outages in its fund transfer service. The SRE team implemented stringent SLOs (99.95% availability), robust monitoring with Grafana, and automated failover to a replica database. This reduced downtime by 60%, improving customer trust.
Scenario 3: Streaming Service
A video streaming platform uses SRE to ensure low latency. By implementing a microservices architecture with Kubernetes, they achieve fault tolerance. Traces via Jaeger identify slow API calls, and automation scripts optimize resource allocation, maintaining user experience during peak usage.
Industry-Specific Example: Healthcare
A telemedicine platform requires high reliability for patient data access. SRE practices include redundant servers, encrypted logging with ELK, and automated backups. SLOs ensure 99.99% availability, critical for life-saving services.
Benefits & Limitations
Key Advantages
- High Availability: Ensures systems meet user expectations (e.g., 99.95% uptime).
- Proactive Issue Detection: Observability tools catch issues before user impact.
- Reduced Toil: Automation frees engineers for strategic tasks.
- Scalability: Reliable systems handle growth efficiently.
Common Challenges or Limitations
- Cost: Redundancy and monitoring tools increase expenses.
- Complexity: Managing distributed systems requires expertise.
- Alert Fatigue: Over-alerting can desensitize teams.
- Trade-offs: Balancing reliability with rapid feature releases (error budgets help).
Best Practices & Recommendations
Security Tips
- Encrypt logs and metrics to protect sensitive data.
- Implement role-based access control for monitoring tools.
- Regularly audit automation scripts for vulnerabilities.
Performance
- Optimize SLIs (e.g., reduce latency by caching).
- Use chaos engineering (e.g., Netflix’s Chaos Monkey) to test resilience.
- Prioritize critical alerts to avoid fatigue.
Maintenance
- Conduct blameless postmortems to learn from incidents.
- Update SLOs based on user feedback and system evolution.
- Automate repetitive tasks to reduce toil.
Compliance Alignment
- Align SLOs with regulatory requirements (e.g., HIPAA for healthcare).
- Document system architecture and incident responses for audits.
Automation Ideas
- Use Terraform for infrastructure-as-code to ensure consistent deployments.
- Automate rollback mechanisms in CI/CD pipelines.
- Implement auto-scaling based on real-time metrics.
Comparison with Alternatives
| Aspect | SRE Reliability Practices | DevOps | Traditional IT Operations |
|---|---|---|---|
| Focus | Reliability via automation | Collaboration & automation | Manual operations |
| Metrics | SLIs/SLOs, error budgets | CI/CD pipeline metrics | Uptime, ticket resolution |
| Automation | High (e.g., Terraform) | Moderate to high | Low to moderate |
| Incident Response | Blameless postmortems | Collaborative resolution | Reactive fixes |
| Scalability | Designed for scale | Varies by implementation | Limited |
When to Choose SRE Reliability Practices
- Choose SRE: For complex, distributed systems requiring high availability (e.g., cloud-native apps).
- Choose DevOps: For teams prioritizing collaboration and rapid delivery over strict reliability.
- Choose Traditional IT: For legacy systems with minimal automation needs.
Conclusion
Reliability in SRE ensures systems meet user expectations through automation, observability, and proactive incident management. By defining clear SLIs/SLOs, leveraging tools like Prometheus and Grafana, and adopting best practices, SRE teams can build resilient systems. Future trends include AI-driven monitoring for predictive reliability and deeper integration with DevOps. To dive deeper, explore:
- Official Docs: Google SRE Book (
sre.google), Prometheus (prometheus.io). - Communities: Reddit SRE groups, CNCF Slack for Kubernetes/SRE discussions.
This tutorial equips you with the knowledge to implement reliability in SRE, from setup to real-world applications. Start small with monitoring, iterate with feedback, and scale with automation to achieve robust systems.