Introduction & Overview
Mean Time to Repair (MTTR) is a critical metric in Site Reliability Engineering (SRE) that measures the average time taken to repair a system or service after a failure. It is a key indicator of system reliability and operational efficiency, helping organizations minimize downtime and maintain high service availability.
What is MTTR (Mean Time to Repair)?
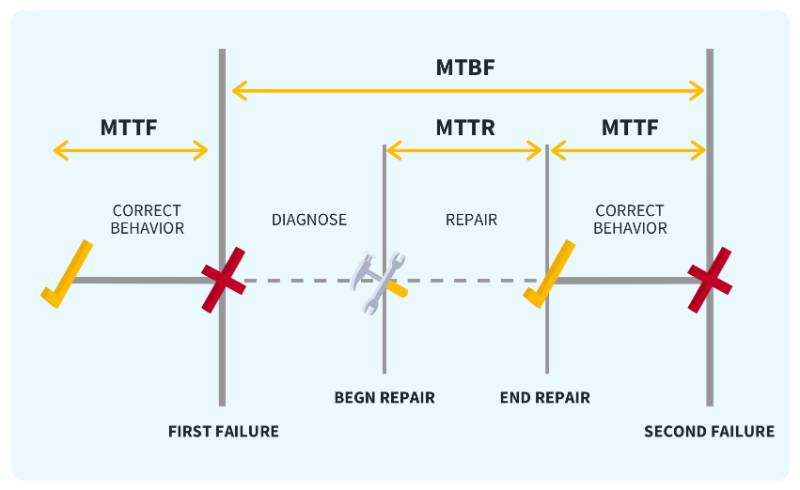
MTTR represents the average duration from the moment a system or component fails to when it is fully restored to operational status. It includes detection, diagnosis, and repair time. In SRE, MTTR is used to assess the efficiency of incident response and recovery processes.
History or Background
The concept of MTTR originated in traditional engineering and manufacturing, where it was used to measure equipment repair times. In the 1990s, as software systems grew in complexity, MTTR was adopted in IT and SRE to quantify service restoration times. Google’s SRE framework popularized MTTR as a core metric for ensuring high availability in distributed systems.
- 1960s–70s: Originated in hardware reliability & manufacturing industries.
- 1980s–90s: Adopted in IT service management (ITIL/SLAs).
- 2000s onwards: Became a core SRE and DevOps metric tied to uptime, customer SLAs, and resilience.
Why is it Relevant in Site Reliability Engineering?
MTTR is vital in SRE because:
- Minimizes Downtime: Lower MTTR ensures faster recovery, reducing user impact.
- Drives Automation: High MTTR often highlights manual processes that can be automated.
- Improves Reliability: Tracking MTTR helps identify recurring issues and optimize systems.
- Aligns with SLAs: Faster repairs ensure compliance with Service Level Agreements (SLAs).
Core Concepts & Terminology
Key Terms and Definitions
| Term | Definition |
|---|---|
| MTTR | Mean Time to Repair: Average time to restore a system after a failure. |
| Incident | An unplanned event causing service disruption or degradation. |
| Service Level Indicator (SLI) | A measurable aspect of service performance (e.g., uptime, latency). |
| Service Level Objective (SLO) | A target value for an SLI, defining acceptable performance. |
| Incident Response | The process of detecting, diagnosing, and resolving incidents. |
| Postmortem | A post-incident analysis to identify root causes and prevent recurrence. |
How MTTR Fits into the SRE Lifecycle
MTTR is integral to the SRE lifecycle, which includes monitoring, incident response, postmortems, and continuous improvement:
- Monitoring: Identifies failures to start the MTTR clock.
- Incident Response: Drives the repair process, directly impacting MTTR.
- Postmortems: Analyze MTTR to identify bottlenecks and improve processes.
- Continuous Improvement: Uses MTTR trends to prioritize automation and system enhancements.
Architecture & How It Works
Components and Internal Workflow
MTTR measurement involves several components:
- Monitoring Tools: Systems like Prometheus, Datadog, or Nagios detect failures and trigger alerts.
- Incident Management System: Tools like PagerDuty or Opsgenie manage alerts and assign responders.
- Logging and Diagnostics: Centralized logs (e.g., ELK stack) help diagnose issues quickly.
- Automation Tools: Scripts or orchestration tools (e.g., Ansible, Kubernetes) execute repairs.
- Communication Platforms: Slack or Microsoft Teams for team coordination during incidents.
Workflow:
- Detection: Monitoring tools detect a failure and send alerts.
- Diagnosis: Engineers analyze logs and metrics to identify the root cause.
- Repair: Fixes are applied manually or via automation (e.g., restarting a service).
- Validation: The system is tested to confirm the issue is resolved.
- Postmortem: The incident is documented, and MTTR is calculated.
Architecture Diagram Description
Since images cannot be included, here is a textual description of the MTTR process architecture:
- Monitoring Layer: Prometheus monitors system metrics (e.g., CPU, latency) and sends alerts to PagerDuty.
- Incident Management Layer: PagerDuty notifies the on-call SRE team via Slack.
- Diagnostic Layer: Logs from ELK stack and metrics from Grafana are analyzed.
- Repair Layer: Kubernetes restarts failed pods, or Ansible runs a repair script.
- Feedback Loop: Postmortem data feeds into Jira for tracking improvements.
   ┌───────────────┐        ┌───────────────┐
   │ Monitoring    │        │ Incident Mgmt │
   │ (Prometheus)  │───────▶│ (PagerDuty)   │
   └───────────────┘        └─────┬─────────┘
                                   │
                         ┌─────────▼─────────┐
                         │ On-Call SRE Team  │
                         │ (Diagnosis/Repair)│
                         └─────────┬─────────┘
                                   │
                         ┌─────────▼─────────┐
                         │ CI/CD Pipeline    │
                         │ (Rollback/Deploy) │
                         └─────────┬─────────┘
                                   │
                         ┌─────────▼─────────┐
                         │ Service Restored  │
                         │   (MTTR measured) │
                         └───────────────────┘
Integration Points with CI/CD or Cloud Tools
- CI/CD: Tools like Jenkins or GitLab CI integrate with MTTR by automating rollbacks or deployments to fix issues.
- Cloud Tools: AWS CloudWatch or Google Cloud Monitoring triggers MTTR workflows by detecting anomalies.
- Orchestration: Kubernetes health checks reduce MTTR by automating pod restarts.
Installation & Getting Started
Basic Setup or Prerequisites
To measure and optimize MTTR, you need:
- A monitoring tool (e.g., Prometheus).
- An incident management system (e.g., PagerDuty).
- Centralized logging (e.g., ELK stack).
- Automation tools (e.g., Ansible, Kubernetes).
- A time-tracking mechanism to log incident start and resolution times.
Hands-on: Step-by-Step Beginner-Friendly Setup Guide
This guide sets up a basic Prometheus and PagerDuty integration to measure MTTR.
- Install Prometheus:
wget https://github.com/prometheus/prometheus/releases/download/v2.47.1/prometheus-2.47.1.linux-amd64.tar.gz
tar xvfz prometheus-2.47.1.linux-amd64.tar.gz
cd prometheus-2.47.1.linux-amd6
./prometheus --config.file=prometheus.yml
2. Configure Prometheus for Alerts:
Edit prometheus.yml:
global:
  scrape_interval: 15s
scrape_configs:
  - job_name: 'my_app'
    static_configs:
      - targets: ['localhost:8080']
alerting:
  alertmanagers:
    - static_configs:
        - targets: ['localhost:9093']
3. Set Up PagerDuty:
- Create a PagerDuty account and generate an API key.
- Configure Prometheus Alertmanager to send alerts to PagerDuty:
receivers:
  - name: 'pagerduty'
    pagerduty_configs:
      - service_key: 'your_pagerduty_service_key'
4. Log Incident Start and Resolution:
Use a script to log timestamps in a database (e.g., PostgreSQL):
import psycopg2
from datetime import datetime

def log_incident(status, incident_id):
    conn = psycopg2.connect("dbname=sre user=admin password=secret")
    cur = conn.cursor()
    cur.execute("INSERT INTO incidents (incident_id, status, timestamp) VALUES (%s, %s, %s)",
                (incident_id, status, datetime.now()))
    conn.commit()
    cur.close()
    conn.close()
5. Calculate MTTR:
Query the database to calculate the average repair time:
SELECT AVG(resolution_time - start_time) AS mttr
FROM (
    SELECT
        start_time,
        resolution_time
    FROM incidents
    WHERE status IN ('start', 'resolved')
) AS incident_times;
Real-World Use Cases
Scenario 1: E-commerce Platform Downtime
An e-commerce site experiences a database outage. Monitoring tools detect high latency, triggering Pager Duty alerts. SREs use logs to identify a query bottleneck, apply an index, and restart the database, reducing MTTR to 30 minutes.
Scenario 2: Microservices Failure in FinTech
A payment microservice fails due to a memory leak. Kubernetes auto-detects and restarts the pod, while SREs patch the code. MTTR is reduced to 15 minutes due to automation.
Scenario 3: Cloud Infrastructure Outage
An AWS EC2 instance fails. CloudWatch triggers an alert, and an Ansible playbook automatically provisions a new instance. MTTR is 20 minutes, including validation.
Industry-Specific Example: Healthcare
In a hospital management system, a server crash disrupts patient scheduling. Monitoring tools detect the issue, and SREs use automated backups to restore the system, achieving an MTTR of 25 minutes.
Benefits & Limitations
Key Advantages
- Improved Reliability: Lower MTTR enhances system uptime.
- Customer Satisfaction: Faster recovery minimizes user impact.
- Data-Driven Decisions: MTTR metrics guide infrastructure improvements.
- Automation Incentive: High MTTR highlights areas for automation.
Common Challenges or Limitations
- Complex Systems: Distributed systems may have cascading failures, inflating MTTR.
- Manual Processes: Lack of automation increases repair time.
- Data Accuracy: Inconsistent incident logging can skew MTTR calculations.
- Human Factors: On-call fatigue or lack of expertise can delay repairs.
Best Practices & Recommendations
Security Tips
- Restrict access to monitoring and repair tools using IAM roles.
- Encrypt incident logs to protect sensitive data.
Performance
- Use distributed tracing (e.g., Jaeger) to pinpoint failure causes quickly.
- Implement health checks in CI/CD pipelines to prevent faulty deployments.
Maintenance
- Regularly update monitoring rules to catch new failure patterns.
- Conduct chaos engineering to simulate failures and optimize MTTR.
Compliance Alignment
- Align MTTR processes with standards like ISO 27001 for incident management.
- Document all incidents in a compliance-ready format (e.g., SOC 2).
Automation Ideas
- Use Infrastructure as Code (IaC) to automate resource provisioning.
- Implement auto-scaling in cloud environments to reduce manual intervention.
Comparison with Alternatives
| Metric/Tool | Description | When to Use | MTTR Advantage |
|---|---|---|---|
| MTBF (Mean Time Between Failures) | Measures time between failures. | Focus on system reliability. | MTTR focuses on recovery speed. |
| MTTD (Mean Time to Detect) | Measures time to detect an issue. | Prioritize early detection. | MTTR includes detection and repair. |
| Incident Management Tools | Tools like ServiceNow for tracking. | Complex enterprise environments. | MTTR integrates with any tool. |
When to Choose MTTR:
- Use MTTR when the goal is to optimize recovery processes.
- Prefer MTTR over MTBF for systems where downtime has high business impact.
- Combine MTTR with MTTD for a holistic view of incident management.
Conclusion
MTTR is a cornerstone of SRE, enabling teams to measure and improve system recovery times. By integrating monitoring, automation, and postmortems, organizations can reduce MTTR, enhance reliability, and meet SLA requirements. Future trends include AI-driven incident prediction and increased automation to further lower MTTR.
Next Steps:
- Implement the setup guide to start tracking MTTR.
- Conduct regular postmortems to identify improvement areas.
- Explore AI tools for predictive maintenance.
Resources:
- Google SRE Book
- Prometheus Documentation
- PagerDuty Community