Introduction & Overview
In the fast-paced world of Site Reliability Engineering (SRE), ensuring rapid response to incidents is critical for maintaining system reliability and user satisfaction. Mean Time to Acknowledge (MTTA) is a key performance indicator (KPI) that measures the average time taken to acknowledge an incident after an alert is triggered. This tutorial provides an in-depth exploration of MTTA, its role in SRE, and practical guidance for implementing and optimizing it in real-world scenarios.
What is MTTA (Mean Time to Acknowledge)?
MTTA is defined as the average duration from when an incident alert is generated to when a team member acknowledges it, signaling the start of active investigation or resolution. Unlike Mean Time to Resolve (MTTR), which covers the entire incident lifecycle, MTTA focuses solely on the initial response phase.
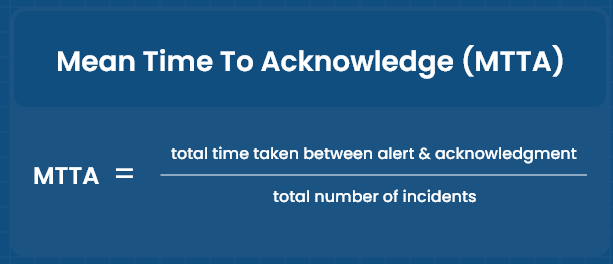
- Formula:
MTTA = (Sum of time between alert and acknowledgment for all incidents) / (Total number of incidents)- Example: If three incidents take 30 seconds, 600 seconds, and 120 seconds to acknowledge, MTTA = (30 + 600 + 120) / 3 = 250 seconds (or ~4.17 minutes).
History or Background
MTTA emerged as a metric in the evolution of IT service management (ITSM) and SRE, driven by the need to quantify responsiveness in incident management. With the rise of DevOps and SRE practices in the early 2000s, pioneered by companies like Google, metrics like MTTA, MTTR, and Mean Time Between Failures (MTBF) became standardized to measure operational efficiency. MTTA specifically addresses the human or system delay in recognizing incidents, a critical factor in minimizing downtime.
Why is it Relevant in Site Reliability Engineering?
MTTA is a cornerstone of SRE because it directly impacts system availability and user experience. In SRE, the focus is on balancing reliability with innovation, and a low MTTA indicates a responsive team capable of mitigating issues before they escalate. Key reasons for its relevance include:
- Reduces Downtime: Faster acknowledgment leads to quicker resolution, minimizing service disruptions.
- Improves Customer Trust: Prompt responses demonstrate reliability, enhancing user confidence.
- Drives Accountability: Tracks team responsiveness, fostering a proactive incident management culture.
- SLA Compliance: Helps meet service-level agreements (SLAs) by ensuring timely incident handling.
Core Concepts & Terminology
Key Terms and Definitions
- Incident: An unplanned event that disrupts or degrades a service.
- Alert: A notification triggered by monitoring systems to indicate a potential issue.
- Acknowledgment: The act of a team member or system confirming an alert, typically via a ticketing system, on-call tool, or manual action.
- MTTR (Mean Time to Resolve): The average time to fully resolve an incident.
- MTTD (Mean Time to Detect): The average time to detect an incident after it occurs.
- MTBF (Mean Time Between Failures): The average time between consecutive system failures.
- SLO (Service Level Objective): A target level of service reliability agreed upon by stakeholders.
- Error Budget: The acceptable amount of downtime or failures within a given period, based on SLOs.
| Term | Definition | Example in SRE |
|---|---|---|
| Incident | An unplanned service disruption | Website outage |
| Alert | Notification triggered by monitoring tools | PagerDuty sends alert |
| Acknowledgment | When an engineer confirms receipt of an alert | Clicking “Acknowledge” in Opsgenie |
| MTTA | Average time between alert trigger and acknowledgment | 4 minutes |
| On-Call Rotation | Schedule defining which engineer responds to alerts | Weekly shifts |
How MTTA Fits into the SRE Lifecycle
MTTA is a critical metric in the incident management phase of the SRE lifecycle, which includes monitoring, alerting, incident response, resolution, and post-mortem analysis. It bridges the gap between detection (MTTD) and resolution (MTTR), ensuring that incidents are addressed promptly. In the SRE lifecycle:
- Monitoring & Alerting: Systems like Prometheus or Datadog detect anomalies and trigger alerts.
- Incident Acknowledgment (MTTA): Engineers or automated systems acknowledge the alert, initiating response workflows.
- Resolution (MTTR): The team diagnoses and resolves the issue.
- Post-Mortem: Teams analyze MTTA and other metrics to identify bottlenecks and improve processes.
Architecture & How It Works
Components and Internal Workflow
MTTA measurement involves several components working together to detect, notify, and acknowledge incidents:
- Monitoring System: Tools like Prometheus, Grafana, or Splunk monitor system health and generate alerts based on predefined thresholds.
- Alerting System: Platforms like PagerDuty, Opsgenie, or Slack notify on-call engineers via email, SMS, or push notifications.
- Incident Management Platform: Tools like Jira, ServiceNow, or Zenduty log alerts and track acknowledgment times.
- Human or Automated Response: An engineer or automated system acknowledges the alert, typically by clicking a button or running a script.
Workflow:
- An incident occurs (e.g., server downtime).
- The monitoring system detects the issue and triggers an alert (MTTD).
- The alert is sent to the on-call team via the alerting system.
- An engineer acknowledges the alert, marking the start of incident response (MTTA).
- The time between alert creation and acknowledgment is recorded and averaged to calculate MTTA.
Architecture Diagram
Below is a textual description of an MTTA architecture diagram, as image generation is not possible:
[Monitoring System: Prometheus/Grafana]
        |
        v
[Alerting System: PagerDuty/Opsgenie]
        |
        v
[Notification Channels: Slack/Email/SMS]
        |
        v
[Incident Management Platform: Jira/Zenduty]
        |
        v
[On-Call Engineer or Automation Script]
        |
        v
[Acknowledgment Recorded] --> [MTTA Calculation]
- Nodes: Represent monitoring, alerting, notification, and incident management systems.
- Arrows: Indicate the flow from incident detection to acknowledgment.
- Labels: Show tools (e.g., Prometheus, PagerDuty) and actions (e.g., Alert Triggered, Acknowledgment).
Integration Points with CI/CD or Cloud Tools
MTTA integrates with modern DevOps and cloud ecosystems to streamline incident response:
- CI/CD Pipelines: Tools like Jenkins or GitLab CI/CD can trigger alerts for failed builds, which feed into MTTA tracking.
- Cloud Monitoring: AWS CloudWatch, Azure Monitor, or Google Cloud Operations Suite provide real-time metrics that trigger alerts for MTTA.
- Automation Tools: Scripts in Python or Bash can auto-acknowledge low-severity alerts, reducing MTTA.
- AIOps Platforms: Splunk ITSI or Balbix use AI to prioritize alerts, ensuring critical incidents are acknowledged faster.
Installation & Getting Started
Basic Setup or Prerequisites
To measure and optimize MTTA, you need:
- Monitoring Tool: Prometheus, Grafana, or Datadog for real-time system monitoring.
- Alerting Tool: PagerDuty, Opsgenie, or VictorOps for notifications.
- Incident Management System: Jira, ServiceNow, or Zenduty to log and track incidents.
- Access Control: Ensure on-call engineers have access to alerting and incident management platforms.
- Network Connectivity: Stable internet for cloud-based tools.
- Time Synchronization: Ensure all systems use NTP (Network Time Protocol) for accurate timestamping.
Hands-On: Step-by-Step Beginner-Friendly Setup Guide
This guide sets up a basic MTTA tracking system using Prometheus, PagerDuty, and Jira.
- Install Prometheus:
- Download and install Prometheus from
prometheus.io. - Configure
prometheus.ymlto monitor your application:
- Download and install Prometheus from
global:
  scrape_interval: 15s
scrape_configs:
  - job_name: 'my_app'
    static_configs:
      - targets: ['localhost:8080']
Start Prometheus: ./prometheus --config.file=prometheus.yml.
2. Set Up PagerDuty:
- Sign up at
pagerduty.comand create a service. - Configure an integration (e.g., Prometheus) to receive alerts.
- Set up an escalation policy to notify on-call engineers via Slack or SMS.
3. Integrate Jira:
- Create a Jira project for incident tracking.
- Install the PagerDuty-Jira integration to auto-create tickets when alerts are triggered.
- Configure a custom field in Jira to record acknowledgment timestamps.
4. Define Alert Rules:
- In Prometheus, create an alert rule in
alerts.yml:
groups:
- name: example
  rules:
  - alert: HighErrorRate
    expr: rate(http_errors_total[5m]) > 0.05
    for: 5m
    labels:
      severity: critical
    annotations:
summary: "High error rate detected"- Reload Prometheus configuration:
curl -X POST http://localhost:9090/-/reload.
5. Acknowledge Alerts:
- When an alert is triggered, PagerDuty notifies the on-call engineer.
- The engineer acknowledges the alert in PagerDuty or Jira, logging the timestamp.
6. Calculate MTTA:
- Export incident data from Jira (e.g., alert time and acknowledgment time).
- Use a script to calculate MTTA:
import pandas as pd
data = pd.read_csv('incidents.csv')  # Columns: alert_time, ack_time
data['diff'] = (pd.to_datetime(data['ack_time']) - pd.to_datetime(data['alert_time'])).dt.total_seconds()
mtta = data['diff'].mean() / 60  # Convert to minutes
print(f"MTTA: {mtta:.2f} minutes")
Real-World Use Cases
Scenario 1: E-Commerce Platform Downtime
An e-commerce platform uses MTTA to track responsiveness to server outages during peak shopping hours. When a server fails, Prometheus detects high latency and triggers a PagerDuty alert. The on-call engineer acknowledges the alert within 2 minutes, achieving a low MTTA. This rapid response prevents significant revenue loss during high-traffic periods like Black Friday.
Scenario 2: Healthcare System Monitoring
In a hospital IT system, MTTA is critical for life-support equipment. A monitoring system (e.g., Datadog) detects a failure in a patient monitoring device and sends an alert via Opsgenie. The IT team acknowledges the alert within 30 seconds, ensuring rapid intervention to maintain patient safety. Industry-specific SLA requirements demand sub-15-minute MTTA for critical systems.
Scenario 3: Financial Trading Platform
A trading platform uses MTTA to monitor API latency. When an API endpoint fails, AWS CloudWatch triggers an alert, and an automated script acknowledges low-severity issues within 10 seconds, keeping MTTA low. For high-severity issues, human acknowledgment occurs within 1 minute, ensuring compliance with financial SLAs.
Scenario 4: Cybersecurity Incident Response
In a security operations center (SOC), MTTA measures how quickly phishing alerts are acknowledged. Splunk ITSI detects a phishing attempt and notifies the SOC team via Slack. The team acknowledges the alert within 45 seconds, enabling rapid containment and reducing the risk of data breaches.
Benefits & Limitations
Key Advantages
| Benefit | Description |
|---|---|
| Faster Incident Response | Low MTTA ensures quick acknowledgment, reducing downtime and escalation risks. |
| Improved SLA Compliance | Helps meet SLA targets by prioritizing rapid response. |
| Enhanced Customer Trust | Prompt acknowledgment demonstrates reliability, boosting user confidence. |
| Data-Driven Insights | Tracks team responsiveness, identifying bottlenecks in workflows. |
Common Challenges or Limitations
| Challenge | Description |
|---|---|
| Alert Fatigue | Excessive alerts can delay acknowledgment, increasing MTTA. |
| Tool Sprawl | Multiple monitoring and alerting tools can complicate workflows. |
| Human Dependency | Manual acknowledgment introduces variability, especially during off-hours. |
| Inaccurate Metrics | Poorly configured monitoring systems may skew MTTA calculations. |
Best Practices & Recommendations
Security Tips
- Role-Based Access: Restrict alert acknowledgment to authorized personnel to prevent unauthorized access.
- Encrypted Notifications: Use secure channels (e.g., HTTPS, encrypted email) for alerts to protect sensitive data.
- Audit Logs: Maintain logs of acknowledgment actions for compliance with regulations like GDPR or HIPAA.
Performance
- Automate Low-Severity Alerts: Use scripts to auto-acknowledge non-critical alerts, reducing MTTA.
- Prioritize Alerts: Implement AI-based tools (e.g., Balbix) to filter high-priority alerts, ensuring faster acknowledgment.
- Optimize On-Call Rotations: Ensure 24/7 coverage with clear escalation policies to minimize delays.
Maintenance
- Regular Reviews: Analyze MTTA trends weekly to identify patterns and improve processes.
- Update Runbooks: Document common incident types and acknowledgment procedures to streamline responses.
- Monitor Tool Health: Ensure monitoring and alerting systems are operational to avoid missed alerts.
Compliance Alignment
- Align MTTA tracking with industry standards (e.g., ISO 27001 for cybersecurity, ITIL for ITSM).
- Use tools like ServiceNow to integrate MTTA with compliance workflows, ensuring auditability.
Automation Ideas
- Auto-Acknowledgment Scripts: Use Python or Bash to acknowledge low-severity alerts:
# Example Bash script for auto-acknowledgment
curl -X POST https://api.pagerduty.com/incidents/$INCIDENT_ID/acknowledge \
-H "Authorization: Token token=$API_KEY" \
-H "Content-Type: application/json" \
-d '{"acknowledger":{"id":"$USER_ID","type":"user"}}'- ChatOps Integration: Use Slack bots to allow engineers to acknowledge alerts via commands (e.g.,
/acknowledge <incident_id>).
Comparison with Alternatives
| Metric | Description | Use Case | When to Use |
|---|---|---|---|
| MTTA | Time to acknowledge an incident | Measure team responsiveness | When focusing on initial response efficiency |
| MTTD | Time to detect an incident | Evaluate monitoring system effectiveness | When optimizing alert detection |
| MTTR | Time to resolve an incident | Assess overall incident management | When measuring end-to-end resolution |
| MTBF | Time between failures | Gauge system reliability | When assessing system stability |
When to Choose MTTA Over Others
- Choose MTTA when the goal is to improve team responsiveness and reduce downtime impact.
- Use MTTD for optimizing monitoring systems.
- Use MTTR for end-to-end incident resolution analysis.
- Use MTBF for long-term system reliability planning.
MTTA is preferred in scenarios requiring rapid initial response, such as cybersecurity or healthcare, where delays can have severe consequences.
Conclusion
MTTA is a vital metric in SRE, enabling teams to measure and optimize their responsiveness to incidents. By integrating MTTA with modern monitoring, alerting, and incident management tools, organizations can reduce downtime, meet SLAs, and enhance customer trust. While challenges like alert fatigue and tool sprawl exist, best practices such as automation, prioritized alerts, and regular reviews can mitigate these issues.
Future Trends
- AI-Driven Acknowledgment: AI tools will increasingly auto-prioritize and acknowledge alerts, further reducing MTTA.
- Integrated AIOps Platforms: Unified platforms like Splunk ITSI will streamline MTTA tracking across hybrid cloud environments.
- Zero Trust Integration: MTTA workflows will incorporate zero-trust security principles to enhance response security.
Next Steps
- Start by setting up a basic MTTA tracking system using tools like Prometheus and PagerDuty.
- Analyze MTTA trends monthly to identify improvement areas.
- Explore advanced AIOps tools for automated acknowledgment and prioritization.
Resources
- Official PagerDuty Documentation: pagerduty.com/docs
- Prometheus Documentation: prometheus.io/docs
- Splunk IT Service Intelligence: splunk.com/en_us/products/it-service-intelligence.html
- SRE Community: sre.google and srepath.com