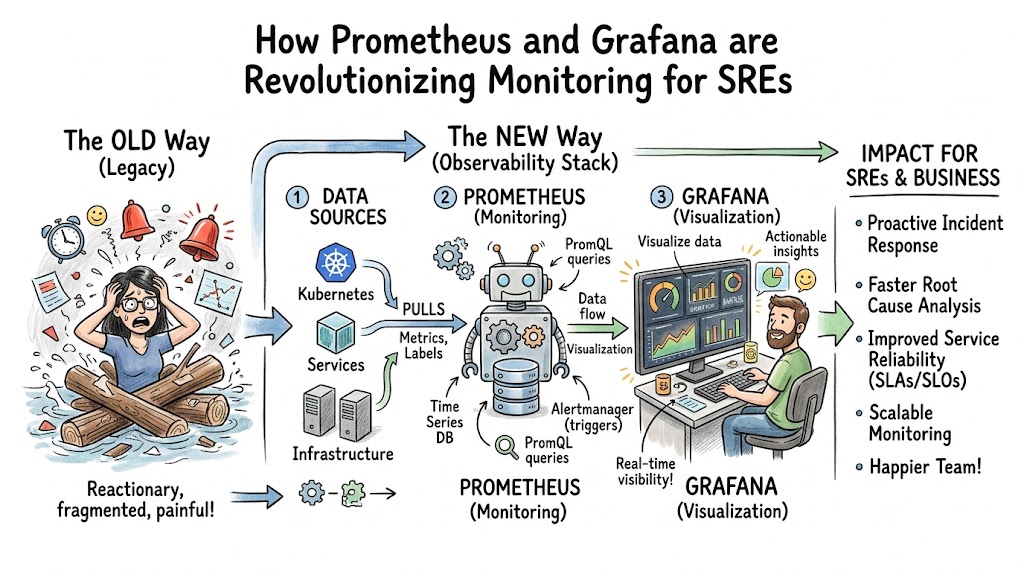
Distributed infrastructure systems often present significant visibility challenges. For a modern Site Reliability Engineer (SRE), keeping complex microservices, Kubernetes clusters, and cloud-native applications running smoothly requires deep visibility. Traditional legacy monitoring tools often fail under dynamic loads because they rely on heavy agents, rigid schemas, and static checks.
This is exactly where the combination of Prometheus and Grafana changes the entire game. Prometheus works as an incredibly fast, highly optimized time-series database that uses an intelligent pull-based model to gather numeric system performance data. Grafana acts as the visual storyteller, turning millions of raw data points into actionable, real-time dashboards that allow humans to spot trends instantly. Together, they shift engineering teams from a reactive state of fighting fires to a proactive state of system optimization.
By adopting this modern observability stack through structured platforms like Sreschool, engineering teams learn to master real-time metrics tracking, dimensional data modeling, and automated alerting. This comprehensive guide covers everything from foundational operational mechanics to real-world deployment strategies, architectural choices, and the culture shifts required to build resilient software systems.
Key Operational Concepts You Must Know
To run reliable systems at scale, engineers must look past basic infrastructure health parameters like simple CPU and memory percentages. You need to understand how data moves, where bottlenecks form, and exactly how users experience your application.
The Core Metrics Frameworks
SRE teams rely on structured frameworks to establish a standard language for system health. Let us break down the two most critical methodologies used across modern production environments.
1. The Four Golden Signals
Developed by Google’s SRE teams, this framework focuses on the four vital signs of any user-facing or internal infrastructure component:
- Latency: The time it takes to service a request. It is essential to separate the latency of successful requests from the latency of failed requests. For example, a 500 Internal Server Error returning in 2 milliseconds can hide a broken database connection if you only track average latency.
- Traffic: A measure of how much demand is being placed on your system. This is typically measured in HTTP requests per second for web applications, or network I/O bits per second for data pipelines.
- Errors: The rate of requests that fail explicitly, implicitly, or by policy. Tracking raw numbers is rarely enough; you must monitor error ratios against total traffic to identify systemic failures.
- Saturation: A measure of how “full” your service is. This highlights the system fraction that is most constrained, such as memory capacity, disk I/O operations, or thread pool exhaustion. Saturation predicts upcoming latency spikes before they hit your users.
2. The RED Method
Specifically designed for microservices and cloud-native architectures by Tom Wilkie, this framework simplifies application-layer monitoring:
- Rate: The number of requests per second entering your microservices.
- Errors: The number of those incoming requests that fail over a specific timeframe.
- Duration: The distribution of time that those requests take to complete, typically analyzed using quantiles.
Prometheus Architecture and Data Model
Prometheus treats data differently than legacy monitoring tools. Instead of consuming unstructured event logs, it works entirely with multidimensional time-series metrics.
+------------------------------------------------------------+
|                     PROMETHEUS SERVER                      |
|                                                            |
|  +---------------+      +-------------------------------+  |
|  |               | ---> |      Retrieval Engine         |  |
|  | Alertmanager  |      |   (Pulls via /metrics HTTP)   |  |
|  |               |      +---------------+---------------+  |
|  +-------^-------+                      |                  |
|          |                              v                  |
|  +-------+-------+      +---------------+---------------+  |
|  |  PromQL       |      |  Time Series Database (TSDB)  |  |
|  |  Engine       | <--- |  (Local block storage)        |  |
|  +---------------+      +-------------------------------+  |
+------------------------------------------------------------+
Every single data point stored in the local Time Series Database (TSDB) consists of a metric name, a set of key-value pairs known as labels, a millisecond-precision timestamp, and a float64 numeric value. The fundamental format looks like this:
$$\text{metric\_name}\{\text{label\_key}=\text{“label\_value”}\} \rightarrow \text{value}$$
For instance, tracking web request latency looks like this:
$$\text{http\_requests\_total}\{\text{method}=\text{“POST”},\text{handler}=\text{“/login”},\text{status}=\text{“500”}\} \rightarrow 42$$
This design allows for incredible query flexibility. Using Prometheus Query Language (PromQL), an engineer can isolate a single faulty service instance or aggregate performance across an entire global infrastructure region with a single query string.
The Power of Grafana Visualization
If Prometheus represents the analytical brain of your operations, Grafana serves as the visual communication layer. It decouples the data query process from visual representation, allowing engineers to build unified operational dashboards.
Grafana connects natively to Prometheus, parsing PromQL expressions and converting raw time-series arrays into highly intuitive graphs, heatmaps, and stat panels. Rather than staring at thousands of scrolling lines in a terminal window, SREs can use Grafana to normalize metrics across different hardware profiles, map operational hierarchies, and overlay deployment markers directly onto time-series timelines. This makes it simple to see if a sudden spike in errors correlates perfectly with a new production application deployment.
Platform Implementation vs. Culture — What’s the Real Difference?
Many engineering teams assume that installing a new tool immediately modernizes their operations. However, tools alone cannot fix broken organizational structures or poor communication habits. True reliability requires balancing platform technology with an intentional operational culture.
| Operational Attribute | Platform Implementation Focus | Engineering Culture Focus |
| Primary Goal | Deploying reliable software binaries, agents, and exporters. | Designing resilient communication loops and failure-tolerant systems. |
| Incident Handling | Setting up automated alerting channels and routing rules. | Conducting blameless post-mortems to discover root system issues. |
| System Validation | Tracking raw infrastructure resource boundaries. | Defining user-centric SLOs and managing engineering error budgets. |
| Dashboard Ownership | Building standardized global reusable templates. | Creating customized, intent-driven views for specific target audiences. |
The Technical Foundation: Platform Implementation
Platform implementation covers the concrete engineering tasks required to build out your telemetry infrastructure. This means writing infrastructure-as-code manifests to deploy Prometheus instances, configuring secure scraping profiles, and setting up Grafana storage backends for long-term data retention.
SRE teams focus on automating these deployments so that every new microservice or cloud compute instance registers its metrics endpoint automatically via service discovery. This layer is entirely objective, dealing with data compression, storage input/output throughput, encryption keys, and query execution times.
The Human Engine: Engineering Culture
Culture determines how your engineering teams actually respond to the data on those screens. A perfectly configured Prometheus server is useless if engineers ignore high-severity alerts because of alert fatigue, or if they hide system mistakes out of fear of retribution.
A healthy SRE culture treats system failures as opportunities to learn and grow. When a major production incident happens, the team runs a blameless post-mortem. Instead of trying to find a single engineer to blame, the group analyzes the systemic gaps that allowed the human mistake to impact production. They ask questions like: Why did our Prometheus alert rules fail to give us early warning? How can we improve our Grafana panels to help engineers diagnose this exact problem in under two minutes next time?
Aligning Business Intent with Technical Realities
To bridge the gap between platform implementation and culture, teams use Service Level Objectives (SLOs) and Error Budgets. This aligns raw engineering metrics directly with actual customer satisfaction.
+-----------------------------------------------------------+
|               SRE ALIGNMENT FRAMEWORK                     |
|                                                           |
|  [ Service Level Indicators ]  --> Raw PromQL Data        |
|               |                                           |
|               v                                           |
|  [ Service Level Objectives ]  --> Reliability Target (%)  |
|               |                                           |
|               v                                           |
|  [     Error Budgets        ]  --> Allowable Downtime     |
+-----------------------------------------------------------+
- Service Level Indicators (SLIs): The precise quantitative compliance measurements pulled from your data via PromQL. For example: The percentage of HTTP requests serviced with a latency under 200ms over a rolling 30-day window.
- Service Level Objectives (SLOs): The target reliability percentage specified for an SLI. For instance: We commit to maintaining our latency SLI at 99.9% compliance.
- Error Budgets: The inverse of your SLO ($100\% – \text{SLO}$). A 99.9% SLO leaves you with a 0.1% error budget. This budget represents the acceptable amount of system failure your business can tolerate before customers get frustrated.
If a team ships features too quickly and causes frequent production micro-outages, they consume their error budget. Once that budget hits zero, the cultural framework takes over: feature deployments freeze, and engineering capacity shifts entirely toward stabilizing infrastructure platforms using Prometheus data guides.
Real-World Use Cases of Modern Operations
Let us explore exactly how Prometheus and Grafana operate in production environments to solve real organizational challenges.
1. Dynamic Kubernetes Cluster Monitoring
Kubernetes environments change constantly, with container pods spinning up and shutting down every few minutes. Traditional static IP-address-based monitoring cannot handle this flux.
Prometheus solves this by integration with the Kubernetes API server for continuous service discovery. As soon as a pod deploys, Prometheus automatically detects its existence, reads its annotations, and starts scraping its /metrics endpoint. SREs couple this with the Node Exporter on bare-metal or cloud hosts, along with cAdvisor for container-level resource statistics.
In Grafana, these data streams are combined into dynamic dashboards. Engineers use drop-down template variables to filter an entire cluster view down to a single namespace, deployment, or individual container pod instantly.
2. High-Cardinality Application Performance Tuning
Consider a microservices system processing global financial transactions. When transaction latencies climb, engineers need to know if the slowness impacts all users or just a specific payment provider variant within a single geographic region.
By embedding Prometheus client libraries directly into application code, developers can expose custom metrics that track database transaction performance, internal memory queue lengths, and downstream API calls. SREs can write specific PromQL queries to isolate these variables:
$$\text{histogram\_quantile}(0.95, \text{sum}(\text{rate}(\text{http\_request\_duration\_seconds\_bucket}[\text{5m}])) \text{ by } (\text{le}, \text{provider}))$$
This query calculates the 95th percentile latency over a 5-minute window grouped specifically by payment provider. Grafana displays this data as a clean time-series line graph, allowing teams to spot identical infrastructure performance anomalies immediately.
3. Automated Proactive Alerting and Anomaly Detection
A true cloud operations team does not sit around watching dashboards waiting for things to break. Instead, they write smart alerting rules in Prometheus that evaluate system trends continuously.
Instead of setting hard, arbitrary thresholds like “Alert if CPU usage is greater than 80%,” modern SREs use mathematical functions to predict system behavior. For example, you can track linear disk growth trends to see if a database volume will run out of space soon:
$$\text{predict\_linear}(\text{node\_filesystem\_free\_bytes}\{\text{mountpoint}=\text{“/data”}\}[\text{4h}], \text{86400}) < 0$$
This rule analyzes the past 4 hours of actual disk space utilization to predict if the storage volume will hit zero bytes within the next 24 hours (86,400 seconds). If the prediction holds true, Prometheus sends a high-priority alert to Alertmanager, which routes it directly to the on-call engineer before any system crash happens.
Common Mistakes in Operations Engineering
Implementing an advanced observability stack is rewarding, but it contains several architectural pitfalls that can easily take down your monitoring infrastructure if you are not careful.
1. Falling into the High-Cardinality Trap
The most common mistake engineers make when setting up Prometheus metrics is misusing labels. Labels are incredibly powerful because they add dimensions to your data, but every unique combination of label values creates a brand-new, independent time series inside the database memory space.
If you attach high-cardinality values like raw user IDs, specific session tokens, or full UUID strings to a metric label, you can quickly generate millions of individual time series. This leads to heavy memory utilization spikes, slow PromQL queries, and can eventually cause your Prometheus server to crash due to out-of-memory errors.
Operational Rule: Keep your labels bounded. If you need to trace individual user transactions or specific unique identifiers, use distributed tracing logs rather than numeric metric time series.
2. Alert Fatigue and Broad Threshold Blunders
When teams first set up a monitoring system, they often experience a wave of excitement and build alerts for every single metric component. This quickly backfires, leading to thousands of low-priority Slack alerts or pager notifications waking up engineers at 3 AM for non-actionable issues.
When engineers get flooded with non-critical notifications, alert fatigue sets in. They start ignoring all alerts, which eventually causes them to miss a major, high-priority production outage signal.
- The Wrong Way: Alerting on temporary CPU spikes, minor memory fluctuations, or single brief HTTP dropouts.
- The Right Way: Alerting strictly on real, user-impacting symptoms, such as sustained high error rates, critical SLO breaches, or predicted infrastructure exhaustion.
3. Overcomplicating Dashboard Layouts
An unmanaged Grafana instance can quickly lead to dashboard sprawl, where teams end up with hundreds of messy panels, inconsistent layouts, and duplicated views across different projects.
+-------------------------------------------------------------+
|               BAD VS. GOOD DASHBOARD DESIGN                |
|                                                             |
|  [ BAD ]   50 panels on one screen, 6 distinct color        |
|            schemes, no variables, high cognitive load.      |
|                                                             |
|  [ GOOD ]  Hierarchical layout, clear template variables,  |
|            RED/Golden Signals focus, context links.         |
+-------------------------------------------------------------+
When an engineer is waking up at 3 AM to debug a major production incident, they should not have to waste precious minutes scrolling through dozens of confusing, unlabelled graphs. Dashboards must be built cleanly and intentionally, keeping the most critical high-level health indicators right at the top of the screen.
How to Become an Operations Expert — Career Roadmap
Transitioning into a world-class Site Reliability Engineer requires a clear, deliberate educational path. You need to combine deep infrastructure knowledge with practical software engineering skills.
Step 1: Master the Core Linux Operating System
Before diving into complex cloud orchestration tools, you must understand the underlying operating system running your code.
- Learn how the Linux kernel manages system calls, schedules CPU threads, and allocates memory segments.
- Master core command-line performance utilities like
top,htop,iotop,vmstat, andstrace. - Understand the virtual filesystem structure, network socket states, and how file descriptors work.
Step 2: Learn Application Architecture and Development
An effective SRE cannot treat software applications like an unresolvable black box. You need to know how code runs in production.
- Build a strong programming foundation in languages widely used across the cloud-native ecosystem, such as Go, Python, or Rust.
- Understand concurrency models, asynchronous programming loops, and common database interaction patterns.
- Learn how to embed instrumentation libraries directly into application code to expose clean, structured metrics.
Step 3: Deep Dive into Prometheus, PromQL, and Grafana
This is where you master your core telemetry platform mechanics.
- Study the internal mechanics of Prometheus, including its scrape loops, local TSDB storage blocks, and retention behaviors.
- Practice writing advanced PromQL expressions using functions like
rate(),increase(),sum(), andhistogram_quantile(). - Learn how to build clean, reusable Grafana dashboard templates using dynamic environment variables and structured panel hierarchies.
Step 4: Master Cloud Orchestration and Distributed Infrastructure Systems
Modern infrastructure is defined entirely by software automation.
- Develop deep operational experience with container platforms like Docker and cloud orchestration engines like Kubernetes.
- Learn how to manage cluster networking rules, configure ingress controllers, and track internal system components.
- Practice infrastructure-as-code automation using tools like Terraform to deploy cloud-native observability stacks reliably.
FAQ Section (add one line space between questions and answers)
- What is the difference between a pull-based monitoring model and a push-based monitoring model?A pull-based system like Prometheus periodically reaches out to configured application endpoints to fetch metrics over simple HTTP. A push-based system requires applications to send their telemetry data out to a centralized collector. Pull models eliminate the risk of overwhelming a central collector during traffic surges and make it easy to spot dead instances that fail to respond to health checks.
- Can Prometheus be used to track individual application log messages?No, Prometheus is explicitly optimized for numeric time-series data and cannot process raw text log streams. For log management, teams pair Prometheus with dedicated log aggregation engines like Grafana Loki, which uses an identical label-matching strategy to correlate metrics with text logs during incidents.
- What is cardinality in the context of Prometheus metrics?Cardinality refers to the total number of unique time-series data combinations generated by a metric and its attached label values. High-cardinality situations occur when labels contain unique, unbounded data points like user IDs, causing massive memory spikes that can degrade database query performance.
- How do Prometheus client libraries affect application performance?Prometheus client libraries are designed to be incredibly fast and lightweight. They update internal metric values using atomic memory operations, which introduces almost zero overhead into your hot application paths, making them safe for high-throughput production services.
- Why should we avoid editing Grafana dashboards directly inside the browser window?Editing dashboards in the browser can lead to drift, untracked changes, and messy dashboard sprawl. SRE teams treat dashboards as code, defining them inside version-controlled JSON configurations or using generation tools like Jsonnet to build and update dashboards through automated CI/CD pipelines.
Final Summary
The combination of Prometheus and Grafana has completely transformed how modern SRE teams observe, analyze, and scale distributed infrastructure systems. By moving away from rigid, legacy monitoring setups toward flexible, multidimensional time-series metrics, software organizations gain the deep visibility needed to spot system failures before they impact users.
However, technology alone is never a complete silver bullet. True reliability requires a strong engineering culture that pairs advanced platform tools with transparent communication habits, practical SLO frameworks, and blameless post-mortem learning practices.
As you continue your engineering journey through specialized educational spaces like Sreschool, focus on mastering both sides of the coin. Build robust telemetry automation pipelines, but also cultivate the engineering mindsets needed to translate raw metrics into resilient, self-healing systems that scale cleanly over time.
One practical challenge not often discussed is metric cardinality growth. As environments scale, poorly designed labels can significantly increase Prometheus storage costs and slow down queries. Long-term success with Prometheus and Grafana depends not only on visibility but also on maintaining efficient telemetry and alerting strategies
With observability adoption increasing, metric governance becomes all the more important. Without clear standards for labels, retention policies, and ownership of dashboards, monitoring systems can become unwieldy to maintain, leading to higher costs and increased time to investigate incidents.