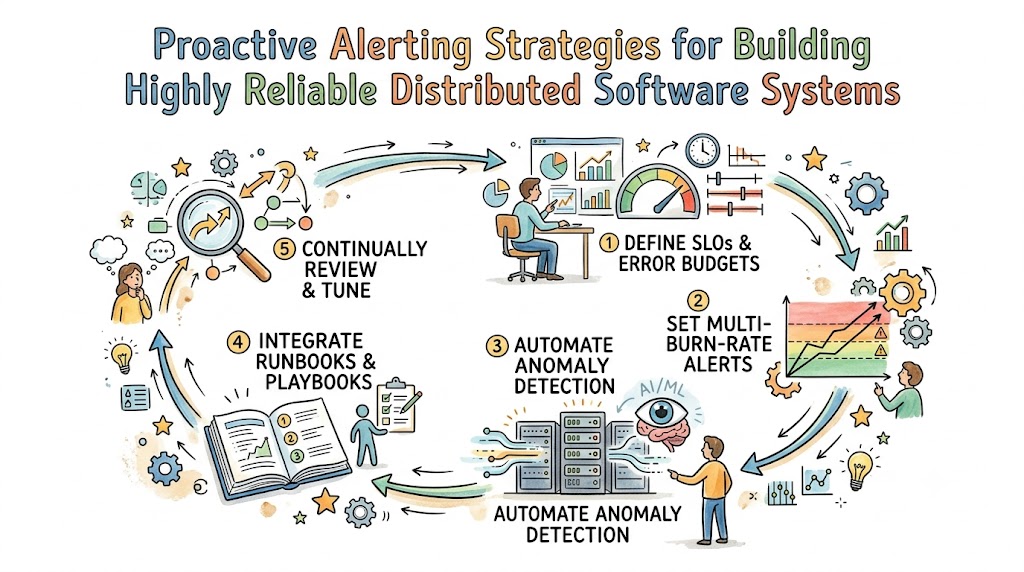
Site Reliability Engineering teams must anticipate infrastructure failures before they cause critical system downtime or disrupt client operations. Relying entirely on reactive monitoring strategies forces engineering squads to scramble constantly during active, high-pressure system blackouts. Therefore, shifting toward predictive, automated anomaly detection allows organizations to maintain stable application performance levels continuously.
Adopting automated threshold tracking protects your systems and ensures software deployments scale smoothly alongside growing user bases. By implementing these sophisticated warning mechanisms, engineering teams can seamlessly patch underlying infrastructure vulnerabilities before clients notice service degradation. You can master these advanced operational workflows by diving into the educational resources available at Sreschool.
Continuous architectural observation requires robust data collection pipelines, clear dashboard visualizations, and well-tuned alerting policies. Consequently, engineering organizations that embrace predictive health analysis find themselves resolving minor structural bugs during regular business hours. Thus, your entire production squad gains deeper confidence while deploying new application features rapidly.
The Core Philosophy of Automated Predictive Telemetry
Modern cloud infrastructure demands a radical evolution away from basic monitoring toward deep system observability. Traditional infrastructure alerting rules only notified on-call response teams after a server crossed a static, arbitrary threshold. Conversely, proactive telemetry analyzes trend data, latency curves, and resource consumption patterns to predict future service interruptions.
Establishing this comprehensive visibility requires engineering teams to instrument all software layers with detailed logging and tracking hooks. Consequently, developers gain real-time insight into the internal state of microservices, cloud resources, and external database dependencies. This deep understanding allows teams to isolate hidden software bugs before they cascade into platform-wide failures.
+-------------------------------------------------------+
|             Proactive vs. Reactive Flow               |
+-------------------------------------------------------+
|  Reactive:  Failure occurs -> Alert fires -> Fix      |
|  Proactive: Anomaly found -> Alert fires -> Prevents  |
+-------------------------------------------------------+
Furthermore, configuring predictive warnings helps organizations protect their customer satisfaction scores by reducing overall system incident duration. Instead of waiting for users to report bugs, automated systems flag slow database queries early. This immediate feedback loop empowers engineers to optimize application code before performance degradation damages client trust.
Ultimately, engineering teams must treat monitoring infrastructure as a core element of the software product itself. By dedicating adequate development time to refining alerting code, you eliminate technical blind spots across the architecture. Therefore, building a proactive detection layer provides a reliable foundation for all modern software delivery platforms.
Key Operational Concepts You Must Know
Defining Multi-Window Multi-Burn-Rate Alerting Policies
Multi-window multi-burn-rate alerting policies evaluate error budgets over multiple distinct time windows to achieve optimal alert precision. For instance, a system might analyze service performance over a brief five-minute window alongside a broader one-hour window. This simultaneous analysis helps the monitoring engine differentiate between brief, self-correcting traffic spikes and severe, systemic infrastructure failures.
                  +-----------------------------------+
                  |      Monitoring Engine            |
                  +-----------------------------------+
                   /                                 \
  (Short 5-Min Window)                             (Long 1-Hour Window)
  Catches sharp, severe drops                      Catches slow, hidden budget leaks
                   \                                 /
                  +-----------------------------------+
                  |   Actionable On-Call Alert        |
                  +-----------------------------------+
By measuring the speed at which your system consumes its error budget, you prioritize your responses accurately. Consequently, teams avoid waking up on-call engineers for minor, transient errors that resolve themselves within moments. This mathematical approach to system health ensures that your notifications remain highly relevant and reliable.
Designing Actionable Alert Playbooks and Runbooks
Every critical notification delivered to an on-call engineer must accompany a direct link to a comprehensive technical runbook. A functional runbook details the exact diagnostic steps, command-line tools, and mitigation options required to resolve the specific alert. This explicit documentation removes panic and guesswork, allowing responders to act systematically under high-pressure scenarios.
[ Automated Alert Fires ] ---> [ Direct Runbook Link ] ---> [ Step-by-Step Mitigation ]
Furthermore, engineering teams should review and update these operational documents whenever the underlying application architecture changes significantly. Outdated documentation slows down incident mitigation and extends the overall duration of system downtime. Therefore, keeping your runbooks accurate is just as critical as maintaining your production application source code.
Establishing Observability Baselines and Seasonal Math
Configuring static thresholds for highly dynamic web applications inevitably results in either missing critical bugs or triggering false alarms. Modern operations teams utilize seasonal mathematical baselines to track performance against historical data from similar time periods. For example, a traffic spike on a Tuesday afternoon is evaluated differently than the same volume on Sunday night.
| Metric Type | Static Evaluation Drawback | Seasonal Baseline Advantage |
|---|---|---|
| Network Traffic | Triggers false pages during regular nightly drops | Adjusts dynamically to predictable hourly user cycles |
| Database Latency | Misses slow degradation if threshold is set high | Detects subtle variations by comparing weekly trends |
| CPU Utilization | Flags safe scheduled maintenance cron jobs | Recognizes scheduled spikes and suppresses noisy alerts |
Applying these dynamic baselines ensures that your monitoring stack adapts naturally to regular human behavior patterns. Consequently, your operational engineering team catches slow, creeping memory leaks that standard static checks frequently miss.
Isolating Signal from Noise in High-Volume Systems
High-volume cloud architectures generate massive amounts of log data, making the isolation of genuine failure signals incredibly challenging. Engineers must implement aggressive filtering, smart tag aggregation, and structured logging formats to manage this data avalanche effectively. Grouping metrics by cluster, region, and service helps teams pinpoint the root cause of an anomaly quickly.
Additionally, monitoring configurations should automatically suppress downstream notifications when a well-known dependency experiences a primary outage. If your central authentication database goes down, you do not need separate alerts from every microservice using it. This structural containment prevents your notification tools from flooding communication channels during an incident.
Platform Implementation vs. Culture — What’s the Real Difference?
Architecting the Technical Monitoring Framework
Building a robust alerting infrastructure requires configuring automated metric collectors, distributed tracing engines, and unified visualization dashboards. Technical tools provide the essential raw processing power needed to evaluate billions of system data points every single day. However, simply deploying these advanced software agents will not automatically guarantee a resilient application platform.
Without conscious engineering design, your automated monitoring platforms will generate massive quantities of irrelevant technical noise. The software tools serve as the engine, but human logic must configure the parameters that make data actionable. Therefore, selecting high-quality monitoring software is only the first step toward achieving continuous application availability.
Cultivating a Blameless Engineering Environment
A healthy operational culture relies completely on psychological safety, ensuring engineers can discuss system failures without fearing personal blame. In a blameless culture, teams treat human mistakes as opportunities to discover deeper structural weaknesses in system design. This transparency encourages developers to share comprehensive post-incident details that help permanently fortify the cloud infrastructure.
+-------------------------------------------------------+
|                 Blameless Culture                     |
|  - Treats mistakes as system design bugs             |
|  - Maximizes transparency during reviews              |
|  - Improves long-term platform resilience            |
+-------------------------------------------------------+
                           ^
                           | (Opposing Approaches)
                           v
+-------------------------------------------------------+
|                  Blameful Culture                     |
|  - Punishes individuals for operational errors        |
|  - Encourages hiding technical system debt            |
|  - Leads to repeating identical platform failures    |
+-------------------------------------------------------+
When organizations penalize mistakes, engineers hide operational bugs, which ultimately leads to more frequent and prolonged system downtime. Conversely, blending powerful tools with a supportive culture ensures that teams build robust, self-healing software environments. Cultivating this shared responsibility helps your organization scale its systems safely while maintaining great team morale.
Real-World Use Cases of Modern Operations
Taming Alert Storms in a Global Financial Microservices Mesh
A large financial services provider suffered from severe alert storms whenever a core payment processing dependency experienced brief latency spikes. The secondary services connected to the mesh would instantly flood the on-call engineers with thousands of identical notifications. This wall of text made it impossible for the responders to isolate the actual origin of the failure quickly.
To fix this, the infrastructure team restructured their monitoring layout by implementing dependency-aware alerting paths and dynamic error budgets. They configured the system to group related errors automatically and suppress alerts from secondary microservices during core outages. This architectural modification reduced noise by 80%, allowing the response squad to isolate and repair failures much faster.
Detecting a Critical Slow-Leak Memory Defect Early
During a major software release, a popular media streaming platform deployed an optimized video encoding service to production. The standard static monitoring checks showed completely healthy operations because CPU and memory levels remained well within safe limits. However, the team’s seasonal baseline algorithms noticed that memory usage was rising by a fraction of a percent every hour.
[ Deploy Code ] ---> [ Static Checks Pass ] ---> [ Baseline Flags Slow 0.5% Hourly Rise ]
                                                            |
                                                            v
                                            (Fix Memory Leak Before Crash)
Because the system used proactive error-budget tracking, it automatically flagged this slow anomaly days before a server crash occurred. The engineering team analyzed the trend line, located a hidden cache retention bug, and safely deployed a software patch. This proactive intervention prevented a massive, customer-facing streaming outage that would have disrupted millions of active viewers.
Common Mistakes in Operations Engineering
Using Arbitrary Static Thresholds for Complex Systems
Setting static limits like flagging an alert whenever CPU usage hits 85% is a classic mistake in modern operations. Modern cloud applications vary their resource consumption constantly based on background jobs, user behavior, and scheduled updates. Using rigid numbers leads to an influx of non-actionable pages, causing engineers to ignore their notification tools.
Teams should focus on metrics that directly impact customer satisfaction, such as error rates and response latency. Keep infrastructure capacity metrics inside passive tracking dashboards rather than using them to wake up your on-call engineers. This distinction keeps your response team sharp and fully focused on resolving critical, revenue-threatening issues.
Ignoring Alert Refinement and Accumulating Technical Debt
Failing to continuously refine your monitoring rules ensures that your engineering organization will eventually struggle with alert fatigue. Many teams deploy monitoring alerts once and never adjust the parameters, even as the application code changes over time. This neglect turns clean dashboards into chaotic walls of red warnings that no engineer trusts or monitors.
On-call squads should dedicate regular engineering time to reviewing every alert that fired during their weekly shift rotation. If a notification did not require immediate human intervention, the threshold should be modified or deleted permanently. Cleaning up your configuration backlog ensures that your monitoring platform stays closely aligned with real system health.
How to Become an Operations Expert — Career Roadmap
Mastering Core Infrastructure Automation and Programming Languages
Building a successful career in operations engineering requires a solid understanding of operating system internals, networking protocols, and automation tools. You must understand how the Linux kernel manages file handles, memory allocations, and network sockets under heavy traffic loads. Additionally, mastering languages like Go or Python allows you to write custom automation tools that eliminate manual tasks.
- Linux System Internals: Learn process scheduling, memory-mapped files, and advanced kernel resource control groups.
- Network Protocol Analysis: Study TCP flow control, HTTP/2 multiplexing, and DNS resolution architectures deeply.
- Automation Engineering: Write clean, modular, and reusable code scripts to automate complex infrastructure deployments.
Focusing on these core engineering skills gives you the technical confidence required to diagnose complex cloud bottlenecks. Automation removes human error from your daily operations, allowing you to focus on high-level system architectural design.
Advanced Cloud Native Architecture and Distributed Observability
As you grow, you must learn to orchestrate large-scale containerized systems using tools like Kubernetes and Terraform. Understanding these abstractions helps you design resilient architectures that scale across multiple availability zones automatically. You must also master distributed tracing frameworks to track network transactions across complex microservice networks.
- Container Mesh Management: Study internal cluster networking, ingress configurations, and automated service discovery protocols.
- Infrastructure as Code: Define entire multi-cloud environments using declarative configuration templates managed in version control.
- Telemetry Collection Design: Implement open-source collection daemons to unify metrics gathering across diverse infrastructure types.
Developing deep expertise in these orchestration frameworks allows you to manage massive, high-traffic cloud environments with minimal manual effort. Consequently, you can build self-healing architectures that adapt dynamically to hardware failures and volatile user traffic.
FAQ Section
- What is the difference between a symptomatic alert and a causal alert?A symptomatic alert flags an issue that directly affects the user experience, such as elevated HTTP error rates. A causal alert points to an underlying technical issue, like a nearly full disk drive on a background server.
- How can engineering teams safely eliminate alert fatigue among on-call responders?Teams must regularly review their monitoring systems and disable pages for non-actionable events that do not require immediate fixes. Moving minor alerts to asynchronous chat channels protects your engineers’ focus and maintains high operational readiness.
- Why should we choose multi-window alerting over single-window monitoring rules?Multi-window rules analyze both short-term and long-term trends simultaneously, which significantly reduces false alarms caused by temporary spikes. This approach allows the system to catch slow, dangerous resource drains while ignoring safe, brief anomalies.
- What details should be included in a standard technical incident runbook?A functional runbook must provide clear definitions of the alert, direct links to specific dashboards, and step-by-step mitigation instructions. It should also list escalation contact details in case the primary on-call responder needs specialized assistance.
- How does an error budget help balance feature development and system stability?An error budget provides a clear, shared metric that determines when teams must stop shipping features to focus on reliability. If the budget is exhausted, engineers pause new deployments and pivot entirely to fixing infrastructure issues.
Final Summary
Implementing proactive alerting strategies is essential for building highly resilient cloud environments that protect your core user experience. By utilizing multi-window burn-rate tracking, dynamic seasonal baselines, and actionable runbooks, teams can handle infrastructure failures calmly and systematically. Balancing these automated observation tools with a supportive, blameless culture keeps your engineering organization sharp, motivated, and successful.
As modern software architectures grow more complex, regular refinement of your monitoring stack serves as your best defense against system downtime. Embracing these core principles helps your organization transform chaotic infrastructure failures into predictable, automated engineering tasks. Ultimately, prioritizing proactive system observation allows your business to innovate rapidly while maintaining a highly reliable platform for your clients.