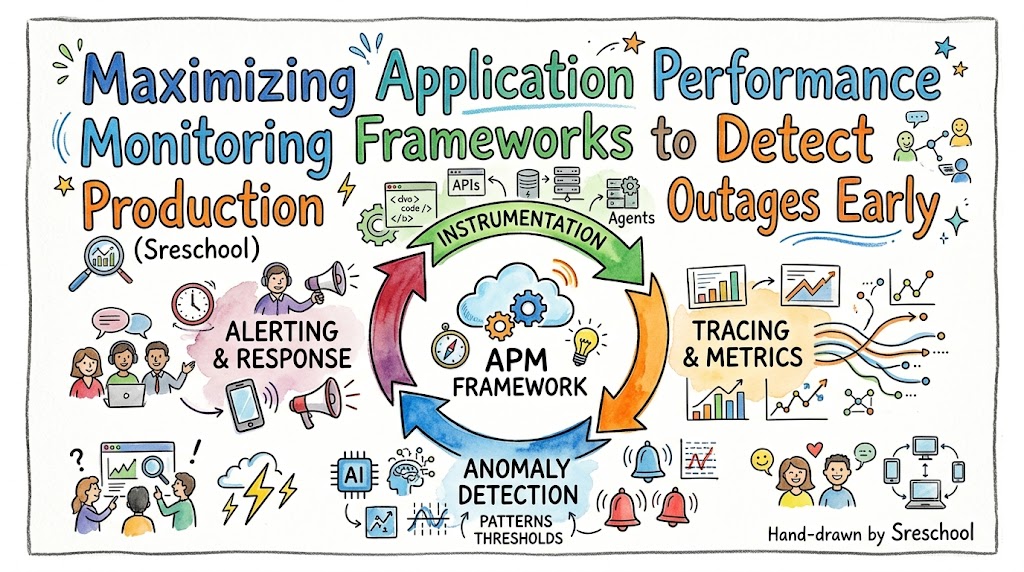
Application Performance Monitoring transforms how modern engineering organizations identify, isolate, and resolve critical production defects before they disrupt end-user workflows. When complex software environments experience latency or unexpected runtime crashes, relying purely on infrastructure metrics like CPU usage falls short. This modern monitoring philosophy bridges the gap between infrastructure metrics and software runtime realities, providing engineering squads with real-time code execution insights.
Integrating an advanced application telemetry strategy ensures your organization maintains continuous system availability while scaling its underlying technical architecture. By establishing deep runtime tracing, software engineers can pinpoint exact bottlenecks and protect customer experiences during high-traffic events. You can accelerate your engineering skills and master these distributed systems monitoring strategies by engaging with the educational pathways at Sreschool.
Continuous application layer discovery requires proper instrumentation, thoughtful threshold configuration, and proactive transaction mapping across all service components. Consequently, software organizations that adopt deep tracing paradigms drastically shorten their time to identify operational regressions. Therefore, your development and operations teams gain unprecedented transparency into live code deployment states, preventing widespread service failures.
Defining Modern Site Reliability Practices
Application Performance Monitoring serves as the cornerstone of progressive site reliability practices by tracking how code executes across live cloud infrastructure. Instead of looking at servers from the outside, this software instrumentation technique measures the precise time it takes to process functions. This localized visibility ensures that software developers catch code regressions immediately after a new deployment goes live.
Furthermore, utilizing runtime telemetry enables operations teams to move beyond basic threshold alerts and look at historical behavioral anomalies instead. Consequently, your monitoring engines can flag subtle database delays before they snowball into full-scale system crashes. This proactive alerting style allows engineering teams to implement code optimizations long before users encounter noticeable performance issues.
Additionally, this discipline breaks down traditional silos by creating a shared language between product engineers and system administrators. Because the tracking maps directly to application endpoints, both developers and operations teams can see exactly which function fails. Therefore, cross-functional collaboration improves dramatically, leading to faster bug fixes and higher software quality.
Ultimately, integrating code-level tracing shifts an organization’s focus from mere survival to continuous architecture improvement. By observing transaction flows across every staging environment, engineering teams can build reliable data baselines. Thus, your business creates a rock-solid operational foundation capable of handling volatile user traffic demands smoothly.
Essential Structural Components of Incident Lifecycles
The modern incident management workflow begins the exact moment an application performance monitor detects a deviation from baseline behavior. During this initial discovery phase, lightweight agents embedded within the code continuously report request transaction times and error percentages. This active tracking ensures that minor memory leaks or unhandled exceptions are caught before they impact downstream components.
Once an anomaly crosses a predetermined threshold, the triage phase automatically prioritizes the event based on real user impact. The system tags the incident with a specific severity rating, allowing on-call engineers to immediately spot system critical regressions. Meanwhile, lower priority bugs are logged directly into standard engineering backlogs to prevent distracting the active responders.
Next, the mitigation stage focuses heavily on restoring core service functionality using targeted diagnostic data provided by the monitoring tool. Responders check the telemetry console to see if the issue stems from a faulty database dependency or an external API failure. With this precise information, they can safely reroute traffic, apply hotfixes, or roll back the deployment.
Finally, the post-incident learning phase capitalizes on stored trace data to prevent identical infrastructure failures from recurring. Engineering squads analyze the historical transaction waterfalls to find the ultimate design flaw that allowed the bug to exist. This analytical review turns every application outage into a valuable educational milestone that strengthens system code.
Key Operational Concepts You Must Know
Understanding Service Level Objectives and Slippage
Service Level Objectives define the precise boundary conditions for your application’s user experience targets, measuring things like transaction success rates. For example, your engineering team might establish an objective stating that 95% of payment transactions must complete within 400 milliseconds. When application latency starts climbing, your metric tracking experiences slippage, warning your teams that your service quality targets are failing.
+-------------------------------------------------------------+
|               Service Level Objective (SLO)                 |
|                   Target: 95% < 400ms                       |
+-------------------------------------------------------------+
                               |
                               v (Latency Increases)
+-------------------------------------------------------------+
|                     Objective Slippage                      |
|            Real-time: 89% < 400ms -> Alert Fired            |
+-------------------------------------------------------------+
Managing this slippage requires setting early warning indicators that notify your on-call engineering staff before you breach your commitments. If slippage occurs frequently, product teams must shift focus from building new features to optimizing underlying code routines. Consequently, this balanced approach guarantees that system reliability remains a core component of your software development cycle.
Calculating and Managing Your Error Budget
An error budget represents the total amount of service degradation your system can tolerate over a month or quarter. If your team commits to a 99.5% successful request rate, you possess a 0.5% budget allowance for software bugs. This mathematical buffer encourages engineering teams to take calculated architectural risks and deploy new features faster.
However, completely draining your budget triggers a mandatory shift in engineering behavior, turning all developer focus toward code optimization. This strict rule ensures that stability issues are fixed before they permanently damage your customer retention metrics. Therefore, tracking your budget consumption rate gives your business a clear view of platform health.
Establishing Clear Severity Levels and Triage Frameworks
Classifying production bugs using standardized severity levels ensures that your technical response teams respond with the right level of urgency. A typical framework organizes incident categories by analyzing user impact, revenue risk, and core service degradation levels. This structural setup takes the guesswork out of incident responses during high-pressure system failures.
| Severity Level | Application Impact | Immediate Responding Strategy |
|---|---|---|
| Sev-1 (Critical) | Core application loop broken for all active users | Page the incident commander; pull in backend database leads. |
| Sev-2 (Major) | Secondary features failing or extreme user latency | Notify component owners; investigate application traces within 15 minutes. |
| Sev-3 (Minor) | Isolated cosmetic error with an existing workaround | Create a standard ticket; resolve the issue during the next sprint cycle. |
Applying this categorization standard across your engineering department keeps technical communications clear and highly efficient. Furthermore, it sets appropriate expectations for corporate stakeholders, keeping teams focused on implementing actual technical fixes.
Designing On-Call Rotations and Escalation Paths
Building sustainable on-call schedules keeps your engineering organization functional and guards your team against severe operational burnout. You should create balanced shift patterns that rotate primary responsibilities fairly across all qualified software engineers. This distribution ensures that the person responding to an early morning alert is alert, capable, and supported.
Additionally, automated escalation rules must be coded into your routing systems to protect against missed notifications. If a primary responder does not acknowledge an application alert within ten minutes, the system pages the backup engineer. This safety net prevents system outages from growing larger while an individual struggles to find the bug alone.
Platform Implementation vs. Culture — What’s the Real Difference?
Deploying the Technical Tooling Infrastructure
Building a modern monitoring setup involves embedding tracking libraries into your software applications and deploying collection agents across cloud servers. These software tools automatically inspect runtime engines, database connections, and external API calls to generate detailed execution metrics. However, simply installing these commercial agents does not automatically make your applications resilient.
Without custom adjustments, your software monitors will generate thousands of meaningless alerts, overwhelming your engineers with unnecessary notifications. The underlying software acts as the information gatherer, but it takes human engineering to turn that data into insights. Therefore, platform deployment is a useful starting step, but it requires human discipline to deliver real value.
Cultivating a Blameless Engineering Environment
A progressive operational culture relies on psychological safety, making sure engineers feel comfortable reporting mistakes without facing punishment. In a blameless engineering culture, teams recognize that code errors are caused by weak processes, not single bad actors. This mindset promotes transparency, prompting engineers to share critical operational data that can permanently patch system weaknesses.
+-------------------------------------------------------+
|                 Blameless Culture                     |
|  - Looks at systemic design gaps                      |
|  - Shares deep failure details openly                 |
|  - Promotes structural security                       |
+-------------------------------------------------------+
                           ^
                           | (Opposing Operational Mindsets)
                           v
+-------------------------------------------------------+
|                  Blameful Culture                     |
|  - Punishes individual developers                     |
|  - Causes engineers to hide errors                    |
|  - Slows down resolution velocity                     |
+-------------------------------------------------------+
When businesses focus on assigning blame, developers naturally hide bugs, which leaves your code vulnerable to recurring outages. Conversely, pairing high-quality tools with a supportive engineering culture helps teams build incredibly durable software systems. Cultivating this shared responsibility helps your company convert every production mistake into an opportunity for growth.
Real-World Use Cases of Modern Operations
Migrating Monolithic Architecture to Resilient Microservices
A rapidly growing financial technology firm suffered from frequent platform outages because its legacy application code was tightly bundled together. To fix this single point of failure, the engineering team split the monolith into independent microservices monitored by distributed tracing tools. This architectural update isolated system components, making sure a bug in the reporting tool could not crash the payment engine.
Additionally, they configured their monitoring software to track downstream latency variations across all external banking connections. As a result of this visibility, their overall system uptime improved dramatically, and software deployment failures dropped. This case study demonstrates how pairing code-level tracking with isolated service structures protects critical business processes.
Mitigating Cascading Database Failures Under Peak Traffic
During a major holiday promotional event, a fast-growing digital retailer saw traffic surge, slowing down its database clusters. The spike in read requests caused application threads to stall, which triggered automated code retry loops from connected servers. This compounding demand created a cascading loop that threatened to take down the entire public-facing website.
[ User Traffic Surge ] ---> [ Stalled App Threads ] ---> [ Complicated Retry Loops ]
                                   ^                                |
                                   |                                v
                                   +--- [ Cascading Resource Drain ] +
Fortunately, the on-call team quickly spotted the database bottleneck using transaction waterfall charts and immediately added a query cache layer. They temporarily turned off non-essential application features to reduce system pressure and let the primary databases recover. Reviewing the stored tracing records after the incident helped them rewrite their database models to prevent future overload loops.
Common Mistakes in Operations Engineering
Misconfiguring Alerting Thresholds and Alert Fatigue
A frequent mistake in operations engineering is setting software monitoring rules to trigger high-priority alerts for minor fluctuations. When engineers get paged multiple times a night for non-critical spikes, they quickly develop alert fatigue. Consequently, team members might accidentally ignore actual emergency alerts, which extends your system downtime.
To avoid this operational trap, teams should refine their alert logic to look at prolonged deviations rather than instant spikes. Make sure high-priority pages only trigger when an issue needs immediate human attention to stop service degradation. This approach keeps your on-call responders focused, alert, and fully prepared to handle real system emergencies.
Neglecting Post-Incident Documentation and Action Items
Failing to write thorough post-mortem reports after an outage makes it highly likely that your team will encounter the same issue again. Some software teams consider an incident closed the moment service returns to normal, ignoring the follow-up work needed to patch the root bug. Without structured documentation, underlying code flaws remain hidden, waiting to cause another failure.
Furthermore, remediation tasks must be treated as regular product requirements and scheduled into upcoming development sprints. If these reliability fixes are ignored, your technical debt will grow, leading to larger and more complex future outages. Dedicating engineering time to fixing structural weaknesses turns incident learnings into actual platform stability.
How to Become an Operations Expert — Career Roadmap
Mastering Foundational Systems and Automation Scripting
Building a successful career in software operations starts with a deep understanding of runtime environments, operating systems, and network protocols. You must understand how programming languages manage memory allocation and execution threads to diagnose tricky performance locks. Additionally, mastering scripting languages like Python or Go lets you automate repetitive manual tasks with clean, scalable code solutions.
- Runtime Diagnostics: Study garbage collection metrics, thread states, and memory heap limits within application engines.
- Network Tracing: Master HTTP status code tracking, connection pooling strategies, and distributed request header structures.
- Automation Engineering: Write reusable software configurations to deploy identical monitoring agents across expanding cloud setups.
Mastering these foundational skills gives you the perspective needed to troubleshoot modern cloud-native architectures. Automation ensures your software deployments stay consistent, reducing human error and freeing up time for high-value system designs.
Deepening Cloud Infrastructure and Orchestration Skills
As you advance in your career, you must learn to manage containerized services using orchestration engines and modern infrastructure tools. These systems let you build self-healing software setups that spin up new application instances automatically when performance metrics drop. Understanding these infrastructure abstractions helps you design platforms that automatically adapt to underlying server issues.
- Container Observability: Learn how to pass request context headers seamlessly through modern container networks.
- Declarative Configurations: Use version-controlled code patterns to deploy, monitor, and update your software stack safely.
- Telemetry Standardization: Implement open data standards to gather unified metrics across diverse software components.
Building expertise in these orchestration workflows allows you to run massive cloud applications with minimal manual oversight. As a result, you can build reliable systems that dynamically handle hardware failures and unpredictable traffic loads.
FAQ Section
- How does APM differ from traditional infrastructure monitoring tools?Traditional tools watch external resource metrics like server CPU, storage space, and basic network availability. Application Performance Monitoring looks inside the runtime engine, analyzing specific code execution loops, database operations, and live transaction traces.
- What is a transaction trace waterfall chart in performance analysis?A trace waterfall chart visually maps the step-by-step path a single request takes through various backend microservices. This detailed timeline allows engineers to spot the precise function or database call causing system latency.
- Should every software application trace be stored permanently in the cloud?No, storing every single trace creates massive data ingestion fees and requires expensive storage management. Engineering teams should use sampling strategies to save all error events while keeping a representative subset of normal transactions.
- What are the most important metrics to watch on an application dashboard?Teams should watch the core metrics of latency, error frequency, transaction volume, and underlying host resource consumption. These signals give you a comprehensive view of both user experience and software stability.
- How does standardizing log metadata help resolve application incidents faster?Standardized metadata ensures that all services output logs containing identical trace identifiers and context tags. This consistency allows engineering teams to search across multiple service logs simultaneously during an outage.
Final Summary
Deploying Application Performance Monitoring tools is essential for maintaining highly responsive, dependable software platforms that retain customer trust. By tracking code-level transactions, managing error budgets, and defining clear triage rules, teams can resolve production issues quickly and methodically. Balancing these powerful data collections with a supportive, blameless team culture keeps your software engineers focused and highly productive.
As distributed cloud systems grow more complex, using automated tracing serves as your strongest defense against extended operational downtime. Embracing these core metrics helps your business turn unexpected system anomalies into valuable engineering improvements. Ultimately, prioritizing deep code observability allows your company to deploy features rapidly while maintaining a highly reliable user experience.