Imagine trying to navigate a ship through a storm with no radar, no compass, and no windows. You would be sailing completely blind, relying purely on guesswork and luck. That is precisely what running modern software systems without proper monitoring feels like.
In the fast-paced world of Site Reliability Engineering (SRE), monitoring is the essential sense that tells us what is happening inside our complex systems. It provides the visibility needed to understand system behavior, detect problems early, and make data-driven decisions about reliability.
Monitoring serves as the critical bridge between the code we write and the experience our users actually receive. Without it, we have no way of knowing if we are meeting our reliability goals or if we are about to experience a catastrophic failure . The practice of SRE fundamentally depends on telemetry data to function, making monitoring the very foundation upon which everything else is built.
When we talk about monitoring in the context of SRE, we are referring to the entire practice of collecting, processing, and analyzing data about our systems’ performance and health. This data empowers teams to move from a reactive, firefighting mode to a proactive stance where issues are identified and resolved before they impact users. By leveraging robust monitoring, organizations can dramatically improve their service reliability and build the kind of trust that keeps users coming back .
At Sreschool, we believe that mastering monitoring is the first and most critical step on your SRE journey. It transforms operations from guesswork into an engineering discipline where every decision is backed by real data from your production environment.
Key Operational Concepts You Must Know
To truly understand why monitoring is the backbone of SRE, you need to grasp a few core operational concepts. These are the building blocks of any robust SRE practice, and they all depend heavily on the quality of your monitoring.
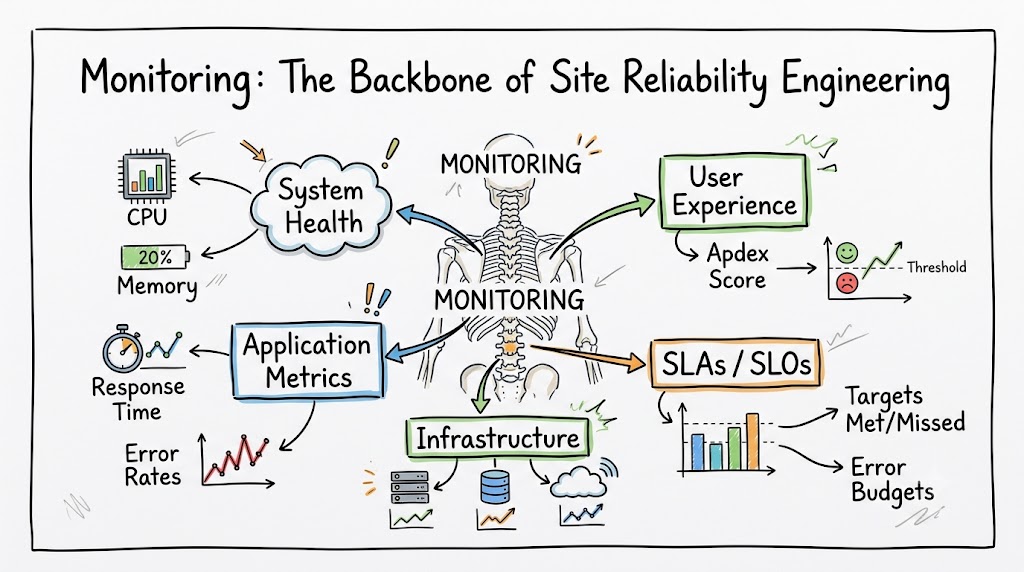
Service Level Indicators (SLIs)
SLIs are the quantitative measures of your service’s reliability, the “what” you are actually measuring. Common SLIs include request latency, error rate, and throughput. A well-defined SLI is a direct reflection of your users’ experience, and monitoring provides the data pipeline to capture these metrics in real-time. Without monitoring, you simply cannot measure your SLIs effectively.
Service Level Objectives (SLOs)
SLOs are the targets you set for your SLIs, defining the level of reliability you are aiming for. For example, you might set an SLO that 99.9% of all requests must be served in under 200 milliseconds. Monitoring helps you track your performance against these SLOs, providing a clear, objective view of whether you are meeting your commitments . This real-time insight is crucial for making prioritization decisions about where to focus engineering effort.
Error Budgets
The error budget is the amount of unreliability you are willing to tolerate, calculated as 100% minus your SLO percentage. If you have a 99.9% SLO, your error budget is 0.1% . Monitoring your error budget consumption enables you to make intelligent trade-offs between reliability and the speed of feature delivery. When the budget is being burned too quickly, a rational decision can be made to halt feature releases until reliability is restored.
The Four Golden Signals
Developed by Google’s SRE team, the Four Golden Signals are the foundational metrics that every team should monitor to get a holistic view of system health: Latency, Traffic, Errors, and Saturation (often abbreviated as “LETS”) .
- Latency: The time it takes to serve a request, but it is crucial to distinguish between the latency of successful and failed requests to get the full picture.
- Traffic: A measure of how much demand is being placed on your system, helping you understand load.
- Errors: The rate of failed requests, which is a direct indicator of service health.
- Saturation: This tells you how “full” your service is, highlighting when you are approaching capacity limits .
Monitoring these four signals gives you a powerful, unified view of your system’s performance and allows you to quickly identify areas that need attention .
Observability
While monitoring is about collecting data and predefined metrics, observability is about the ability to ask new, unplanned questions about your system’s state. It is built on three pillars: metrics, logs, and traces. A good observability platform empowers SREs to investigate and understand the “unknown unknowns” that can lead to complex failures . It provides the depth needed to understand why a problem occurred, moving beyond just knowing that it occurred.
Platform Implementation vs. Culture — What’s the Real Difference?
One of the most common mistakes organizations make when adopting SRE is to focus exclusively on the tools while neglecting the cultural transformation that is equally necessary. The reality is that monitoring and SRE cannot succeed in a vacuum; they require both a solid technical foundation and a supportive environment.
Platform Implementation
This encompasses the technical scaffolding of your SRE practice. It includes the actual tools and systems you use for monitoring, the data pipelines, the dashboards, the alerting systems, and the automation. A robust implementation ensures your SRE teams have reliable, high-fidelity data to analyze system behavior and make decisions.
However, an implementation is just the starting point. Many organizations spend significant resources on implementing sophisticated monitoring platforms like Datadog or Prometheus, but they fail to realize the full value of their investment . A powerful tool is useless if the team lacks the skills or the organizational support to use it effectively. The implementation will also dictate how quickly and effectively your team can act. For example, a platform with intelligent alerting can drastically reduce alert fatigue, a common pain point in cloud operations .
Culture
SRE culture is the set of shared values, beliefs, and practices that guide how your team operates. This is where the real magic happens. It is about fostering a blameless post-mortem culture where incidents are seen as learning opportunities, not opportunities to assign blame . It means embracing risk by using error budgets to guide decision-making rather than obsessing over the arbitrary goal of “100% uptime”.
Crucially, a healthy SRE culture promotes collaboration between development and operations teams, breaking down traditional silos. This fosters a shared responsibility for reliability, where developers understand the operational impact of their code, and SREs are involved early in the design process. Monitoring data becomes the shared language that both teams use to understand their systems and improve them together. The best culture is one where the platform is built to be self-service and where engineers are empowered to own their services in production .
Real-World Use Cases of Modern Operations
Modern operations, powered by robust SRE monitoring, are far more proactive and efficient than the reactive IT operations of the past. Here is how these principles play out in the real world.
Proactive Incident Detection and Avoidance
Instead of waiting for users to report an outage, SRE teams use monitoring to predict and prevent failures. For instance, a sudden increase in latency, one of the four golden signals, can alert an SRE to investigate a potential issue before it becomes a full-blown outage . This proactive stance can dramatically reduce downtime and improve user experience.
Automated Incident Response
Observability platforms can trigger automation when specific conditions are met. For example, if an SLO error budget is burning too quickly, the system can automatically roll back a recent deployment. This automation reduces manual toil and accelerates the mitigation of issues . SRE teams aim to move towards autonomous IT, where the system takes the correct action without waiting for human intervention.
Intelligent Capacity Planning
Monitoring traffic trends provides critical data for future capacity planning. By analyzing usage patterns, an SRE team can predict when they will need additional resources to handle future demand. This prevents performance bottlenecks and ensures the system scales gracefully, even during peak usage.
Improving Developer Productivity
Modern SRE practices are not just about keeping the lights on; they also help developers move faster. By providing self-service monitoring and deployment tools, SREs can create a developer platform that enables teams to deploy applications autonomously with built-in reliability guardrails . When an incident does occur, detailed monitoring data helps pinpoint the cause, leading to faster resolutions and more effective post-mortems.
Driving Financial Efficiency
Monitoring can also lead to significant cost savings. By tracking resource utilization and saturation, teams can identify over-provisioned resources, a common source of cloud waste. This allows organizations to right-size their infrastructure, significantly reducing their cloud bill without sacrificing performance or reliability .
Common Mistakes in Operations Engineering
Even with the best intentions, SRE teams can fall into common traps that undermine their efforts. Being aware of these mistakes is the first step in avoiding them.
Alert Fatigue and Misconfigured Alerts
This is one of the most prevalent issues. Teams often set up alerts for every possible metric, leading to an overwhelming number of notifications that are ignored. The consequence is that critical alerts get buried in the noise. A key best practice is to focus on actionable alerts that directly correlate with user experience, such as SLO violations .
Incomplete Monitoring or Wrong Metrics
Monitoring a system’s CPU is good, but if you are not tracking the end-user experience, you are missing the bigger picture. Common mistakes include not monitoring the four golden signals (latency, traffic, errors, and saturation) or failing to monitor external dependencies . This leaves teams flying blind and unable to diagnose complex issues.
Neglecting Post-Incident Reviews
Failing to conduct thorough and blameless post-incident reviews is a missed opportunity for improvement. Each incident contains valuable lessons that can be used to strengthen the system. Skipping this step means you are destined to repeat the same mistakes . Incident reviews are critical for evolving and maturing your SRE culture.
Poorly Defined SLOs and SLIs
Setting SLOs that are not meaningful or SLIs that do not reflect user experience is a common failure mode. An SLO that is either too easy to achieve does not push for improvements, while one that is unattainable will just cause frustration. SLOs need to be realistic, business-aligned, and carefully defined .
Manual Processes and Toil
Relying on manual interventions is the antithesis of SRE principles. Manual processes are slow, error-prone, and create “toil”—repetitive operational work that can be automated. SRE practices like automating deployments, rollbacks, and infrastructure provisioning are essential to reduce toil and free up engineers for more valuable work .
Platform Over-Engineering
Conversely, some organizations spend years building a perfect platform, delaying its delivery. SRE teams should aim to build a “minimum viable platform” and iterate on it based on developer feedback. Building the perfect platform before anyone uses it often leads to a solution that does not fit the actual needs.
How to Become an Operations Expert — Career Roadmap
Becoming an expert in SRE and operations is a rewarding journey that blends software engineering with systems knowledge. Here is a practical roadmap to guide you.
Step 1: Master the Fundamentals
Start by building a strong foundation in core SRE concepts and Linux systems administration. Understand the OS, networking, and storage. Familiarize yourself with the SRE book from Google and the core principles like embracing risk, service level objectives, and eliminating toil. This is the bedrock of your expertise . Simultaneously, practice with monitoring tools like Prometheus or Datadog to understand how metrics are generated and consumed.
Step 2: Learn Key Programming Languages and Automation
SRE is not just about running commands; it is about writing code to manage systems. Focus on learning languages like Python and Go, which are widely used in the SRE ecosystem. You should be comfortable writing scripts to automate everything from server provisioning to data collection and analysis. Version control with Git is also a non-negotiable skill.
Step 3: Gain Deep Experience with Cloud and Container Technologies
Modern SRE is synonymous with cloud and containerization. Obtain deep, hands-on experience with a major cloud provider (AWS, GCP, or Azure). Master Kubernetes and Docker, as they are the building blocks for modern microservices. Your monitoring knowledge must extend to these dynamic environments .
Step 4: Cultivate a Proactive and Collaborative Culture
Develop a mindset focused on proactive problem-solving. Cultivate excellent communication skills, as you will often be the central point of contact during incidents and a key collaborator with development teams. Never stop being curious about how systems work and how they can be improved . Learn to advocate for the user experience and balance that with business needs.
Step 5: Specialize and Teach Others
As you gain experience, you can specialize in areas like chaos engineering, observability, or performance optimization. More importantly, you should start mentoring junior engineers and sharing your knowledge. Teaching others solidifies your own understanding and demonstrates true mastery. You become an expert not just by knowing things, but by helping others learn.
FAQ Section
What are the Four Golden Signals in SRE monitoring?
The Four Golden Signals are Latency (time to serve a request), Traffic (demand on the system), Errors (rate of failed requests), and Saturation (how “full” the service is). They are a set of essential metrics that provide a comprehensive view of system health.
How does observability differ from monitoring?
Monitoring is the process of collecting and tracking predefined metrics and logs to know when something is wrong. Observability is a broader concept that focuses on understanding why a system is behaving in a certain way, allowing you to ask new questions about the system’s state.
What is an error budget in SRE?
An error budget is the amount of unreliability your service can tolerate, calculated as 100% minus your Service Level Objective (SLO). It provides a rational, data-driven way to balance the need for reliability against the need for new features and fast development.
Why is alert fatigue a problem in operations?
Alert fatigue happens when SRE teams receive an overwhelming number of alerts, often for non-critical issues. This leads to them ignoring or missing important alerts, which can cause major outages. The goal is to have intelligent, actionable alerts.
What is the role of automation in SRE?
Automation is a core principle of SRE used to eliminate manual and repetitive tasks known as “toil.” This allows engineers to spend more time on high-value engineering work like improving system design and building self-healing capabilities.
What is the difference between SRE and DevOps?
DevOps is a broader cultural philosophy that aims to break down silos between development and operations teams. SRE is a specific, prescriptive implementation of that philosophy that uses software engineering principles to manage operations and achieve specific reliability goals.
Final Summary
Monitoring is not just a supporting player in Site Reliability Engineering; it is the absolute foundation upon which the entire discipline is built. It provides the vital visibility needed to understand our systems, measure our success, and make informed decisions. From the core metrics of the Four Golden Signals to the deep analysis enabled by observability, monitoring empowers teams to move from a reactive, chaotic state to a proactive, engineering-led discipline.
A successful SRE practice requires a careful balance of robust platform implementation and a supportive, collaborative culture. It is a journey of continuous improvement, where the insights from monitoring lead to automation, better incident responses, and ultimately, a more reliable and resilient user experience. As we have explored, avoiding common mistakes like alert fatigue and manual toil is just as important as adopting the right tools.