Introduction & Overview
Monitoring is a cornerstone of Site Reliability Engineering (SRE), enabling teams to ensure system reliability, performance, and availability in dynamic, large-scale environments. It provides real-time insights into system health, helping SREs proactively detect issues, respond to incidents, and optimize operations. This tutorial offers an in-depth exploration of monitoring within the SRE context, covering its principles, setup, real-world applications, and best practices.
What is Monitoring?
Monitoring in SRE involves continuously observing and analyzing a system’s performance and health through data collection, metrics, logs, and traces. It aims to provide visibility into system behavior, detect anomalies, and trigger alerts for potential issues. Unlike traditional IT monitoring, SRE monitoring emphasizes automation, actionable insights, and alignment with user experience.
- Purpose: Ensures systems meet Service Level Objectives (SLOs) by tracking key metrics like latency, traffic, errors, and saturation (the “Golden Signals”).
- Scope: Encompasses infrastructure, applications, and network performance in distributed systems.
History or Background
Monitoring has evolved significantly with the rise of distributed systems and cloud computing. Its roots trace back to early network management tools like Nagios (1999), which focused on basic server health checks. The concept gained prominence with Google’s Site Reliability Engineering practices in the early 2000s, pioneered by Benjamin Treynor Sloss. Google’s Borgmon system introduced scalable, metrics-based monitoring, setting the standard for modern SRE practices. Today, tools like Prometheus, Grafana, and Datadog dominate, offering advanced observability for cloud-native environments.
Why is it Relevant in Site Reliability Engineering?
Monitoring is critical in SRE for the following reasons:
- Proactive Issue Detection: Identifies potential failures before they impact users, reducing downtime.
- SLO Compliance: Ensures systems meet defined reliability targets, balancing innovation and stability.
- Incident Response: Provides data to diagnose and resolve issues quickly, minimizing Mean Time to Resolution (MTTR).
- Scalability: Supports the management of complex, distributed systems by automating monitoring tasks.
- User-Centric Focus: Aligns system performance with user expectations, enhancing customer experience.
Core Concepts & Terminology
Key Terms and Definitions
- Metrics: Quantitative measurements of system performance (e.g., CPU usage, request latency).
- Logs: Detailed records of events, useful for debugging and auditing.
- Traces: Tracks a request’s journey through a system, critical for microservices.
- Golden Signals: Four key metrics in SRE monitoring:
- Latency: Time taken to process a request.
- Traffic: Volume of requests or transactions.
- Errors: Rate of failed requests.
- Saturation: Resource utilization (e.g., CPU, memory).
- Service Level Indicators (SLIs): Measurable metrics reflecting user experience (e.g., uptime, response time).
- Service Level Objectives (SLOs): Target values for SLIs, defining acceptable performance.
- Service Level Agreements (SLAs): Contracts with customers based on SLOs.
- Error Budget: Acceptable downtime or failure rate, balancing reliability and feature development.
- Observability: The ability to understand a system’s internal state from its external outputs, encompassing monitoring, logging, and tracing.
| Term | Definition | Example |
|---|---|---|
| Metrics | Numerical data points representing system health | CPU usage = 70% |
| Logs | Timestamped records of system/app events | 2025-08-20 10:12:01 Error: DB connection failed |
| Traces | Detailed path of requests across services | Request latency = 500ms across microservices |
| SLI | Service Level Indicator (quantitative metric) | Latency < 200ms |
| SLO | Service Level Objective (target for SLI) | 99.9% uptime |
| SLA | Service Level Agreement (contractual guarantee) | 99.5% uptime for customers |
| Alerting | Notification mechanism for issues | PagerDuty SMS on service crash |
| Dashboards | Visual representation of data | Grafana dashboard for system metrics |
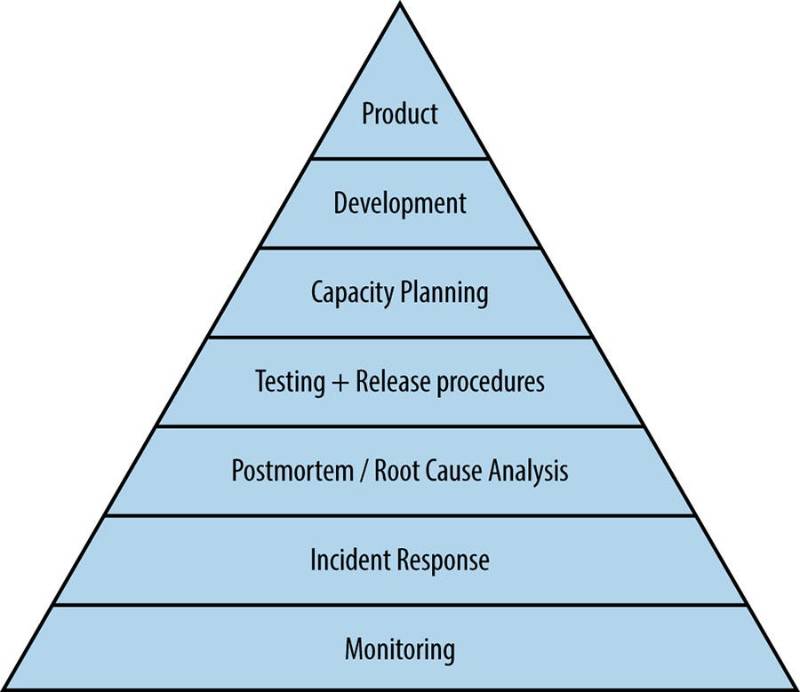
How It Fits into the Site Reliability Engineering Lifecycle
Monitoring is integral to the SRE lifecycle, which includes design, deployment, operation, and optimization:
- Design: Define SLIs/SLOs based on user needs.
- Deployment: Integrate monitoring into CI/CD pipelines to track deployment impacts.
- Operation: Use real-time monitoring to detect and respond to incidents.
- Optimization: Analyze monitoring data to improve system performance and reduce toil.
Architecture & How It Works
Components
A typical monitoring system in SRE comprises:
- Monitoring Agents: Collect metrics/logs from servers, applications, or containers (e.g., Prometheus Node Exporter).
- Data Storage: Time-series databases (TSDBs) like InfluxDB or Prometheus store metrics efficiently.
- Stream Processing: Tools like Apache Flink process real-time data for alerts.
- Visualization: Dashboards (e.g., Grafana, Kibana) display metrics and trends.
- Alerting System: Notifies engineers via email, pager, or chat (e.g., PagerDuty, Slack).
- API/Integration Layer: Connects monitoring tools with CI/CD or cloud platforms.
Internal Workflow
- Data Collection: Agents collect metrics/logs from infrastructure and applications.
- Data Processing: Stream processing systems analyze data against predefined rules.
- Storage: Metrics are stored in a TSDB for querying and historical analysis.
- Visualization: Dashboards aggregate and display data for easy interpretation.
- Alerting: Threshold-based rules trigger notifications for anomalies.
- Analysis: SREs use data to diagnose issues and optimize systems.
Architecture Diagram
The diagram below illustrates a typical monitoring architecture in SRE:
                +-------------------------+
                |   Users / Clients       |
                +------------+------------+
                             |
                             v
                   +---------+---------+
                   |  Applications     |
                   |  (Microservices)  |
                   +---------+---------+
                             |
            +----------------+-----------------+
            | Metrics Exporter  |   Log Agent   |
            +-------------------+---------------+
                             |
              +--------------+---------------+
              | Monitoring Backend (Prometheus|
              |   / ELK / Datadog, etc.)      |
              +--------------+---------------+
                             |
                 +-----------+-----------+
                 | Visualization (Grafana) |
                 +-----------+-----------+
                             |
                 +-----------+-----------+
                 | Alerting (PagerDuty,  |
                 | Slack, Email, etc.)   |
                 +-----------------------+
- Monitoring Agents: Deployed on servers/containers, pushing metrics to a message queue.
- Message Queue: Buffers data to handle high throughput.
- Stream Processing: Analyzes data in real-time, triggering alerts if thresholds are breached.
- Time-Series DB: Stores metrics for querying and historical analysis.
- Visualization: Displays metrics on dashboards for monitoring.
- Alerting System: Sends notifications to SREs via integrated tools.
Integration Points with CI/CD or Cloud Tools
- CI/CD: Monitoring integrates with tools like Jenkins or GitLab CI to track deployment metrics (e.g., success/failure rates).
- Cloud Platforms: AWS CloudWatch, Azure Monitor, or GCP Operations Suite provide native monitoring for cloud resources.
- Automation: Tools like Terraform or Ansible configure monitoring infrastructure as code.
- Observability Tools: Prometheus and Grafana integrate with Kubernetes for container monitoring.
Installation & Getting Started
Basic Setup or Prerequisites
To set up a monitoring system using Prometheus and Grafana:
- Hardware/Software Requirements:
- Server with at least 2 CPU cores, 4GB RAM, and 20GB storage.
- Operating System: Linux (e.g., Ubuntu 20.04).
- Docker for containerized deployment (optional).
- Dependencies:
- Install Prometheus (metrics collection/storage).
- Install Grafana (visualization).
- Install Node Exporter (for system metrics).
- Network Access: Ensure ports 9090 (Prometheus) and 3000 (Grafana) are open.
Hands-On: Step-by-Step Beginner-Friendly Setup Guide
- Install Prometheus:
wget https://github.com/prometheus/prometheus/releases/download/v2.47.0/prometheus-2.47.0.linux-amd64.tar.gz
tar xvfz prometheus-2.47.0.linux-amd64.tar.gz
cd prometheus-2.47.0.linux-amd64
./prometheus --config.file=prometheus.yml
Edit prometheus.yml to define scrape targets:
global:
  scrape_interval: 15s
scrape_configs:
  - job_name: 'node'
    static_configs:
      - targets: ['localhost:9100']
2. Install Node Exporter:
wget https://github.com/prometheus/node_exporter/releases/download/v1.6.1/node_exporter-1.6.1.linux-amd64.tar.gz
tar xvfz node_exporter-1.6.1.linux-amd64.tar.gz
cd node_exporter-1.6.1.linux-amd64
./node_exporter
3. Install Grafana:
sudo apt-get install -y adduser libfontconfig1
wget https://dl.grafana.com/oss/release/grafana_10.1.0_amd64.deb
sudo dpkg -i grafana_10.1.0_amd64.deb
sudo systemctl start grafana-server
4. Configure Grafana:
- Access Grafana at
http://localhost:3000(default login: admin/admin). - Add Prometheus as a data source (URL:
http://localhost:9090). - Import a dashboard (e.g., Node Exporter Full, ID: 1860).
5. Set Up Alerts:
- In
prometheus.yml, add alert rules:
groups:
- name: example
  rules:
  - alert: HighCPUUsage
    expr: rate(node_cpu_seconds_total{mode="user"}[5m]) > 0.8
    for: 5m
    labels:
      severity: critical
    annotations:
summary: "High CPU usage detected on {{ $labels.instance }}"- Configure Alertmanager for notifications (e.g., Slack integration).
Real-World Use Cases
- E-Commerce Platform:
- Scenario: A retail company monitors its online store to ensure 99.95% availability.
- Application: Prometheus tracks latency and error rates during peak sales. Grafana dashboards display real-time metrics, and alerts notify SREs of checkout failures.
- Outcome: Reduced cart abandonment by 20% through proactive issue resolution.
- Financial Services:
- Scenario: A bank uses monitoring to ensure transaction processing meets SLOs.
- Application: Datadog monitors transaction latency and error rates, with anomaly detection identifying fraud patterns.
- Outcome: Achieved 99.99% uptime, meeting regulatory requirements.
- Streaming Service:
- Scenario: A video streaming platform monitors content delivery networks (CDNs).
- Application: AWS CloudWatch tracks buffering rates and CDN latency. Alerts trigger on high saturation, prompting resource scaling.
- Outcome: Improved streaming quality, reducing user complaints by 15%.
- Healthcare Application:
- Scenario: A telemedicine platform monitors API performance for patient consultations.
- Application: New Relic monitors API response times, with traces identifying bottlenecks in microservices.
- Outcome: Ensured HIPAA-compliant reliability, maintaining trust.
Benefits & Limitations
Key Advantages
- Proactive Issue Detection: Identifies issues before they impact users.
- Scalability: Handles large-scale, distributed systems efficiently.
- Automation: Reduces manual toil through automated alerts and dashboards.
- User-Centric: Aligns metrics with user experience (e.g., SLOs).
Common Challenges or Limitations
- Alert Fatigue: Too many alerts can overwhelm SREs.
- Complexity: Configuring monitoring for microservices is challenging.
- Cost: Commercial tools like Datadog can be expensive.
- Data Overload: Large volumes of metrics/logs require efficient storage and querying.
Best Practices & Recommendations
- Define Clear Metrics: Focus on Golden Signals and user-centric SLIs.
- Automate Alerts: Use tools like Alertmanager to reduce manual intervention.
- Regular Reviews: Update monitoring configurations to reflect system changes.
- Security Tips:
- Encrypt sensitive metrics/logs.
- Restrict access to monitoring dashboards using RBAC.
- Performance: Use time-series databases optimized for high write/query loads.
- Compliance: Align with standards like GDPR or HIPAA for data handling.
- Automation Ideas: Integrate monitoring with Infrastructure as Code (IaC) for dynamic setup.
Comparison with Alternatives
| Tool/Approach | Strengths | Weaknesses | Best Use Case |
|---|---|---|---|
| Prometheus | Open-source, scalable, Kubernetes-native | Steep learning curve, no built-in log storage | Cloud-native apps, microservices |
| Datadog | Comprehensive, easy to use, cloud integrations | Expensive, vendor lock-in | Enterprise environments |
| Nagios | Simple, reliable for small setups | Limited scalability, outdated UI | Legacy systems |
| AWS CloudWatch | Native AWS integration, managed service | Limited outside AWS, costly at scale | AWS-based applications |
When to Choose Monitoring
- Prometheus: Ideal for open-source, Kubernetes-based systems requiring flexibility.
- Datadog: Suited for enterprises needing all-in-one observability.
- Nagios: Best for small, static environments.
- CloudWatch: Optimal for AWS-centric deployments.
Conclusion
Monitoring is a critical practice in SRE, enabling teams to maintain reliable, scalable systems. By leveraging tools like Prometheus and Grafana, SREs can achieve real-time visibility, reduce downtime, and align with user expectations. Future trends include AI-driven anomaly detection and tighter integration with DevOps practices. To get started, explore the following resources:
- Official Docs: Prometheus, Grafana
- Communities: SRE Slack, Reddit SRE
- Next Steps: Experiment with Prometheus in a sandbox environment and join SRE communities for knowledge sharing.