Introduction
A fast application keeps users happy. A slow application can drive visitors away.
Businesses need software that works well under different conditions. They must check speed, stability, and system behavior before problems reach users.
Performance testing helps teams do this work. It checks how an application behaves under different workloads. It can reveal slow pages, weak servers, and other problems.
The right testing tool makes this work easier. Some tools focus on load testing. Others measure real browser performance or support large enterprise systems.
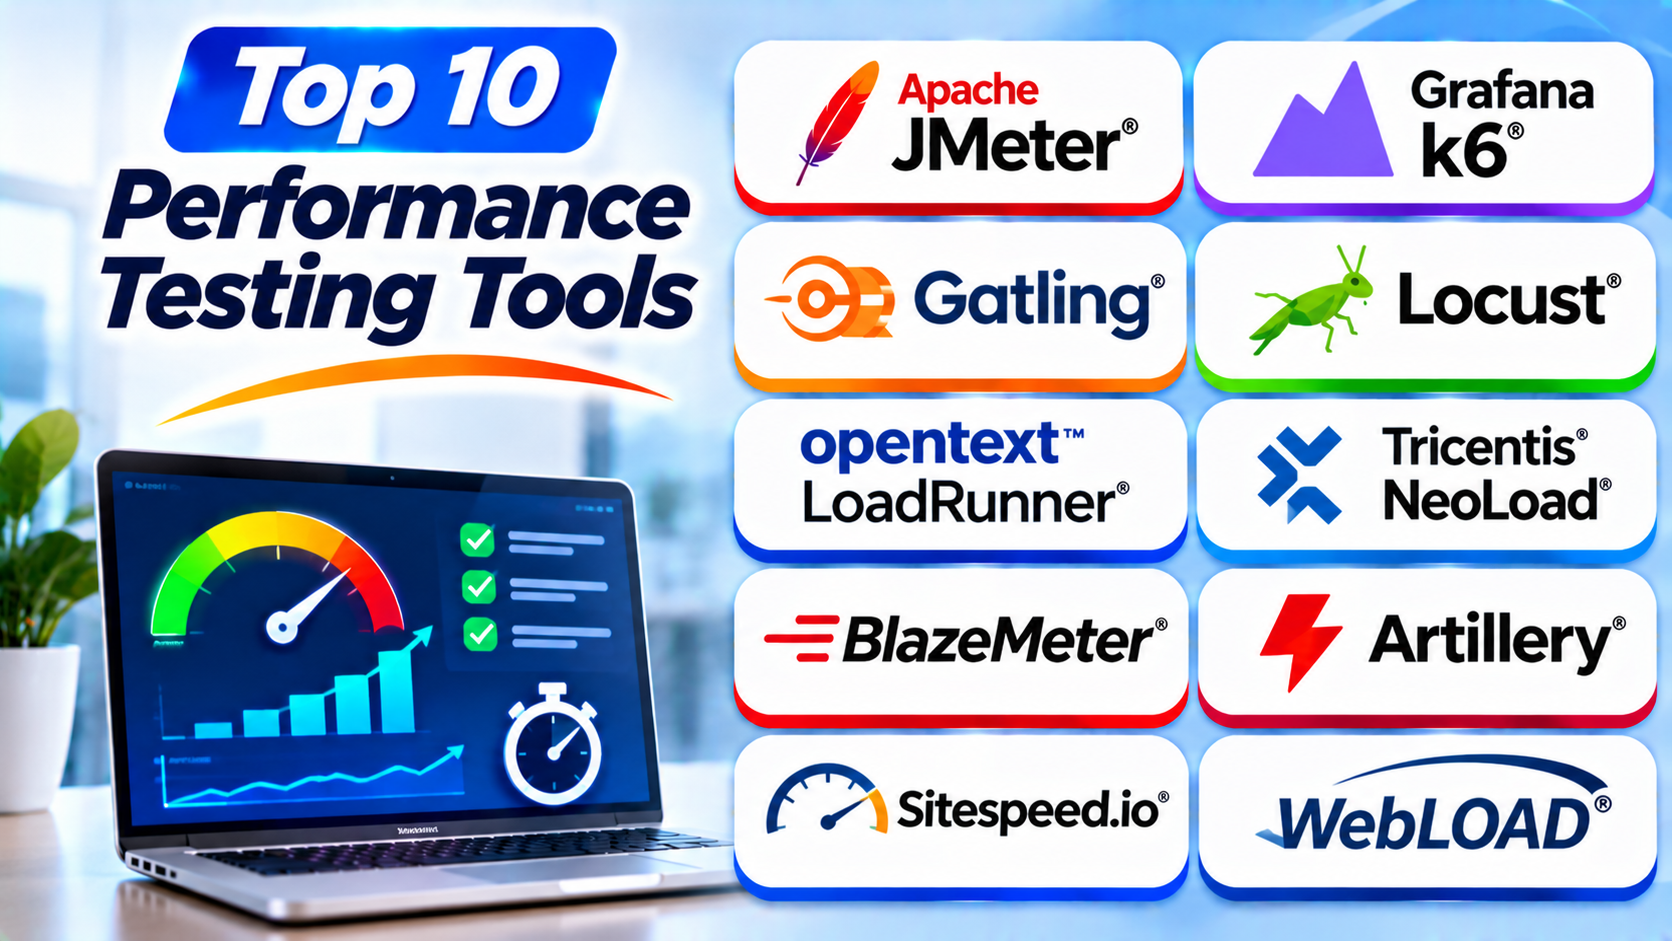
This guide explores ten popular performance testing tools. You will learn their features, Pros, Cons, and best uses.
What Is Performance Testing?
Performance testing checks how well an application works under different conditions.
It helps teams understand speed, stability, scalability, and resource use. They can test websites, mobile apps, APIs, databases, and enterprise software.
Performance testing includes several types:
- Load Testing: Checks performance under expected user traffic.
- Stress Testing: Pushes an application beyond normal limits.
- Spike Testing: Checks how the system handles sudden traffic changes.
- Endurance Testing: Measures performance during long test periods.
- Scalability Testing: Checks how well the system handles growth.
- Volume Testing: Checks how an application handles large amounts of data.
Performance testing tools help teams run these tests and study the results.
Top 10 Performance Testing Tools
1. Apache JMeter
Apache JMeter is a popular open-source performance testing tool. It helps teams test websites, APIs, databases, and other services.
JMeter offers a graphical interface for creating test plans. Users can add requests, set virtual users, and define test steps.
It also supports command-line execution. This makes it useful for automated testing and continuous integration workflows.
JMeter supports several protocols. These include HTTP, HTTPS, FTP, JDBC, and JMS. Plugins can add more features.
Teams can create reports to review response times and errors. These reports help them find performance problems.
Key Features
- Open-source testing platform.
- Graphical test plan editor.
- HTTP and HTTPS testing.
- Database testing through JDBC.
- Supports several communication protocols.
- Plugin support.
- Distributed testing.
- Command-line test execution.
- Performance reports.
Pros
- Free to use.
- Supports many protocols.
- Offers a large plugin ecosystem.
- Provides a visual test editor.
- Has a large user community.
- Works across different operating systems.
Cons
- Large test plans can become difficult to manage.
- Heavy GUI use can consume system resources.
- Real browser behavior needs other tools.
- Advanced test design requires practice.
Best For: QA teams, API testing, database testing, and organizations that need flexible open-source performance testing.
2. Grafana k6
Grafana k6 is a developer-focused performance testing tool. It helps teams write tests as code.
Developers usually create k6 tests with JavaScript. They can store these tests in version control and run them during software development.
This approach helps teams find performance problems early. They can run tests before merging code or releasing an application.
k6 supports HTTP and API testing. It also offers browser testing through its browser module.
Teams can use the open-source version locally. Grafana Cloud k6 provides managed testing and additional cloud features.
Key Features
- JavaScript-based test scripts.
- Open-source testing engine.
- HTTP and API testing.
- Browser testing features.
- CI/CD integration.
- Performance thresholds.
- Detailed test metrics.
- Grafana monitoring integration.
- Cloud-based execution options.
Pros
- Fits developer workflows.
- Uses readable JavaScript scripts.
- Supports automated testing.
- Works with monitoring systems.
- Offers an open-source version.
- Helps teams track performance over time.
Cons
- Requires scripting knowledge.
- The graphical test design experience is limited.
- Large cloud tests may require a paid plan.
- Teams need to learn its scripting model.
Best For: Developers, DevOps teams, API testing, and teams that run performance tests in CI/CD pipelines.
3. Gatling
Gatling is a performance testing platform designed for high-load applications. It helps teams test APIs, websites, and backend services.
Gatling supports several programming languages and developer workflows. Teams can create tests with Java, JavaScript, TypeScript, Kotlin, and Scala options.
Its test engine uses an efficient asynchronous approach. This helps teams generate substantial traffic without creating a separate heavy process for every virtual user.
Gatling provides reports that show response times, request rates, and errors. Teams can use these results to understand application behavior.
The open-source edition supports local testing. Gatling Enterprise adds managed execution and collaboration features.
Key Features
- Code-based test creation.
- Multiple programming language options.
- HTTP and API testing.
- Detailed performance reports.
- CI/CD integration.
- Reusable test scenarios.
- High-load testing support.
- Enterprise options for larger teams.
Pros
- Supports high-load testing.
- Offers detailed reports.
- Fits developer workflows.
- Supports several languages.
- Provides an open-source edition.
- Works well with automated pipelines.
Cons
- Requires coding skills.
- Beginners may need time to learn its test model.
- Some advanced features require commercial plans.
- Complex scenarios need careful scripting.
Best For: Development teams, API performance testing, and organizations that need code-based testing.
4. Locust
Locust is an open-source performance testing tool written in Python. It lets developers describe user behavior with Python code.
This approach gives teams control over test scenarios. They can model actions such as logging in, searching, viewing products, and submitting forms.
Locust includes a web-based interface. Users can start tests, adjust virtual user counts, and view results.
It also supports distributed testing. Teams can use multiple machines to generate more traffic.
Locust works well for teams that already use Python. They can use familiar programming tools to build realistic test scenarios.
Key Features
- Python-based test scripts.
- Web-based test interface.
- Distributed load generation.
- Custom user behavior.
- HTTP testing.
- Real-time performance statistics.
- Command-line execution.
- Python workflow integration.
Pros
- Free and open-source.
- Uses a familiar programming language.
- Offers flexible test scenarios.
- Provides a simple web interface.
- Supports distributed testing.
- Fits automated development workflows.
Cons
- Requires Python knowledge.
- Some protocols need custom code or extensions.
- Advanced scenarios can take time to build.
- Teams must manage their own load generators.
Best For: Python developers, custom user journeys, API testing, and teams that want code-based control.
5. OpenText LoadRunner
OpenText LoadRunner is an enterprise performance testing platform. It helps organizations test complex applications and business systems.
The LoadRunner family includes different products and testing options. These support a wide range of application protocols and testing environments.
Teams can use recording and scripting features to create test scenarios. They can simulate users and study how applications behave under heavy traffic.
LoadRunner also provides reporting and analysis features. These help performance engineers find bottlenecks and investigate failures.
Large organizations often use it for enterprise applications and complex systems. Its broad protocol support can help teams test older and newer technologies.
Key Features
- Enterprise performance testing.
- Broad protocol support across its product family.
- Recording and scripting options.
- Virtual user simulation.
- Performance monitoring and analysis.
- Test result reporting.
- Enterprise testing workflows.
- Distributed test execution options.
Pros
- Supports complex enterprise environments.
- Offers broad protocol coverage.
- Provides detailed analysis features.
- Fits large performance testing teams.
- Supports established testing workflows.
Cons
- Commercial licensing can be costly.
- Advanced features require training.
- Setup may take time.
- Smaller teams may not need its full capabilities.
Best For: Large enterprises, complex business applications, and teams that need broad protocol support.
6. Tricentis NeoLoad
Tricentis NeoLoad is an enterprise performance testing platform. It helps teams test web applications, APIs, and business systems.
NeoLoad offers visual test design and code-based options. This gives both testers and developers ways to create performance tests.
It supports continuous testing workflows. Teams can connect performance checks with software delivery pipelines.
NeoLoad also provides test reports and analysis tools. These help teams understand response times and identify performance issues.
Organizations can use it for modern applications and complex enterprise systems. Teams should check supported protocols and integrations for their own environment.
Key Features
- Visual test design.
- Code-based testing options.
- Web and API performance testing.
- CI/CD integration.
- Test result analysis.
- Enterprise application support.
- Collaboration features.
- Reusable test scenarios.
Pros
- Supports visual and code-based testing.
- Fits enterprise testing workflows.
- Offers useful reporting features.
- Supports continuous performance testing.
- Helps teams manage complex test scenarios.
Cons
- Commercial pricing may be high.
- Advanced features need training.
- Setup can require planning.
- Some integrations depend on the selected product setup.
Best For: Enterprise QA teams, complex business applications, and organizations that need visual performance testing.
7. BlazeMeter
BlazeMeter is a performance testing platform that helps teams run tests at scale. It supports popular open-source testing tools and provides cloud-based execution options.
Teams can use existing test scripts with supported frameworks. This helps them extend their testing setup without starting from scratch.
BlazeMeter also offers reporting and collaboration features. These help teams review test results and share performance information.
Its cloud services can help organizations generate traffic from different locations. This is useful when teams want to understand how applications respond to users in different regions.
BlazeMeter suits teams that need managed testing and shared performance reports.
Key Features
- Cloud-based test execution.
- Supports popular open-source testing tools.
- Performance reporting.
- Distributed load generation.
- Team collaboration features.
- CI/CD integrations.
- Test result analysis.
- Support for existing test scripts.
Pros
- Helps scale existing test scripts.
- Supports several testing frameworks.
- Offers cloud-based execution.
- Provides shared reports.
- Fits team-based testing workflows.
Cons
- Paid plans can increase costs.
- Advanced features may need training.
- Cloud testing depends on network access.
- Some capabilities depend on the selected plan.
Best For: Teams that want cloud-scale testing and managed execution for existing performance scripts.
8. Artillery
Artillery is a modern performance testing tool for APIs and applications. It supports code-based and configuration-based test creation.
Teams can define test scenarios with YAML or JavaScript. This helps developers create repeatable tests and store them with application code.
Artillery supports HTTP and API testing. It also offers browser testing through its Playwright integration.
Teams can run tests locally or use supported cloud infrastructure. Its approach works well for modern JavaScript and cloud-native development teams.
Artillery also supports CI/CD workflows. This helps teams check application performance during development.
Key Features
- YAML and JavaScript test creation.
- HTTP and API testing.
- Playwright browser testing support.
- CI/CD integration.
- Cloud-based load generation options.
- Reusable test scenarios.
- Performance reporting.
- Automated test execution.
Pros
- Fits JavaScript development teams.
- Offers flexible test creation.
- Supports API and browser testing.
- Works with automated pipelines.
- Supports cloud-native testing workflows.
Cons
- Requires technical knowledge.
- Advanced scenarios need scripting.
- Some cloud features may involve extra costs.
- Teams must understand its configuration model.
Best For: Node.js teams, API developers, and organizations that want browser and API performance testing.
9. Sitespeed.io
Sitespeed.io is an open-source tool for measuring website performance. It helps teams understand how quickly web pages load and how visitors experience them.
Unlike tools that mainly generate large amounts of traffic, Sitespeed.io focuses on browser-based performance measurements.
It can collect important website metrics. These include page load timing and Core Web Vitals. Core Web Vitals measure parts of the user experience, such as loading speed and visual stability.
Sitespeed.io can test pages with real browser engines through its supported tools. Teams can also run it in automated workflows.
It helps developers find slow resources and website performance problems.
Key Features
- Open-source website performance testing.
- Browser-based page analysis.
- Core Web Vitals measurement.
- Page load timing reports.
- Automated website testing.
- CI integration.
- Performance budget support.
- Detailed performance results.
Pros
- Free and open-source.
- Focuses on real browser performance.
- Helps measure user experience.
- Provides useful page reports.
- Supports automated workflows.
- Helps find slow website resources.
Cons
- Does not replace a full load testing tool.
- Browser tests need suitable infrastructure.
- Advanced setup requires technical knowledge.
- Results can vary with test environment and network conditions.
Best For: Frontend developers, website owners, and teams that want to improve page speed and Core Web Vitals.
10. WebLOAD
WebLOAD is a commercial performance testing platform from RadView. It helps organizations test websites, APIs, and enterprise applications.
WebLOAD provides test creation, execution, and analysis features. Teams can use its scripting options to model user activity and application traffic.
It also offers monitoring and reporting features. These help performance engineers understand how applications behave under different workloads.
WebLOAD supports different deployment approaches. Organizations can explore cloud, on-premises, and hybrid testing options based on their needs.
It suits teams that need a commercial platform for complex performance testing.
Key Features
- Website and API performance testing.
- Script-based test creation.
- Virtual user simulation.
- Performance monitoring.
- Detailed reporting.
- Cloud and on-premises options.
- Enterprise testing support.
- Custom test scenarios.
Pros
- Supports complex testing needs.
- Offers detailed reporting.
- Provides flexible deployment options.
- Supports website and API testing.
- Fits enterprise performance teams.
Cons
- Commercial licensing adds costs.
- Advanced scripting requires experience.
- Smaller teams may find it complex.
- Teams need time to learn its features.
Best For: Enterprise QA teams, complex web applications, and organizations that need commercial performance testing.
Comparison Table of the Top 10 Performance Testing Tools
| Tool | Main Strength | Test Creation | Best For |
|---|---|---|---|
| Apache JMeter | Broad protocol support | GUI and test plans | QA and API testing |
| Grafana k6 | Tests as code | JavaScript | Developers and CI/CD |
| Gatling | High-load code-based testing | Multiple languages | Performance engineering |
| Locust | Custom user behavior | Python | Python development teams |
| OpenText LoadRunner | Enterprise protocol coverage | Recording and scripting | Large organizations |
| Tricentis NeoLoad | Visual enterprise testing | Visual and code-based | Enterprise QA teams |
| BlazeMeter | Managed cloud execution | Existing scripts and supported frameworks | Distributed testing |
| Artillery | API and browser testing | YAML and JavaScript | Node.js teams |
| Sitespeed.io | Real browser performance | Automated browser tests | Website speed optimization |
| WebLOAD | Enterprise performance testing | Script-based | Complex business systems |
Performance Testing vs. Load Testing
People often use these terms together. However, they do not mean exactly the same thing.
| Area | Performance Testing | Load Testing |
|---|---|---|
| Main Goal | Checks speed, stability, and scalability | Checks behavior under expected traffic |
| Scope | Covers several types of performance checks | Focuses on planned user or request loads |
| Testing Types | Load, stress, spike, endurance, and more | Normal and peak workload checks |
| Main Metrics | Response time, throughput, errors, and resource use | Response time, throughput, and error rate |
| Purpose | Finds performance weaknesses | Checks capacity under a defined workload |
Load testing is one part of performance testing. A complete performance plan may also include stress, spike, and endurance tests.
How to Choose the Right Performance Testing Tool
The best tool depends on your application, team skills, and testing goals. Review these points before making a decision.
1. Identify What You Want to Test
First, decide which part of your system needs testing.
You may need to test a website, API, database, mobile backend, or enterprise application.
Some tools focus on HTTP and APIs. Sitespeed.io focuses more on browser-based website performance. Other tools support many protocols and complex business systems.
Choose a tool that supports your application technology.
2. Consider Your Team’s Skills
Your team should feel comfortable creating and managing tests.
JMeter offers a graphical test editor. k6 uses JavaScript. Locust uses Python. Artillery supports YAML and JavaScript.
Choose a tool that matches your team’s current skills. This can reduce training time.
3. Check Load Generation Options
Think about how much traffic you need to simulate.
A small test may run on one machine. Larger tests may need distributed or cloud-based load generators.
Check how the tool handles virtual users and test distribution.
4. Review Reporting Features
Good reports help teams understand test results.
Look for response time, throughput, error rate, and resource usage. Also check whether the tool can export results or connect with monitoring platforms.
Clear reports help teams find problems faster.
5. Check Automation Support
Modern teams often run performance tests during software development.
Look for CI/CD integrations and command-line support. These features help teams repeat tests after code changes.
Automation also makes performance checks part of regular development work.
6. Consider Cloud and On-Premises Needs
Some teams prefer cloud testing. Others need to run tests inside their own infrastructure.
Cloud tools can reduce setup work. On-premises tools may offer more control over test environments.
Choose a deployment model that fits your security and infrastructure rules.
7. Compare Total Cost
Some tools are free and open source. Others charge for cloud usage, virtual users, licenses, or enterprise features.
Consider the cost of hosting, training, support, and maintenance. Also check whether the tool needs extra infrastructure.
Choose a platform that fits your budget and future testing needs.
Benefits of Performance Testing
Performance testing helps teams understand how applications behave under different conditions. It offers several important benefits.
Finds Performance Problems: Teams can find slow requests and weak system components before launch.
Improves User Experience: Faster and more stable applications can make visitors happier.
Prepares for Busy Periods: Tests help teams prepare for sales, campaigns, and other traffic spikes.
Checks System Capacity: Teams can learn how much traffic their infrastructure can handle.
Supports Better Planning: Test results help teams plan server resources and infrastructure changes.
Reduces Outage Risk: Finding weak points early can reduce the chance of traffic-related failures.
Improves Release Confidence: Teams can use repeatable tests to check performance before releasing updates.
Common Challenges in Performance Testing
Performance testing can reveal problems, but the process also has challenges.
Unrealistic Test Scenarios: Tests may not reflect real user behavior. Teams should model common user journeys.
Limited Test Infrastructure: Small machines may not generate enough traffic. Distributed testing can help.
Complex Test Scripts: Some applications need advanced scripts. Teams may need extra training.
Incorrect Test Data: Poor test data can produce misleading results. Use realistic and safe test data.
Unclear Results: Large reports can confuse teams. Focus on useful metrics and clear performance goals.
Production Risks: Poorly planned tests can affect live applications. Test in controlled environments whenever possible.
Best Practices for Performance Testing
Follow these practices to get useful and reliable results.
- Define clear performance goals before testing.
- Build realistic user journeys.
- Use test data that reflects real application activity.
- Start with small tests before increasing traffic.
- Monitor servers and databases during each test.
- Check response times and error rates.
- Repeat tests after important code changes.
- Test normal, peak, and long-running workloads.
- Avoid running uncontrolled tests against production systems.
- Record results and compare them over time.
Questions and Answers About Performance Testing Tools
1. What is a performance testing tool?
A performance testing tool checks how an application behaves under different conditions. It can measure speed, stability, response time, throughput, and resource use.
2. Which performance testing tool is best overall?
Apache JMeter, Grafana k6, and Gatling are strong choices. The right tool depends on your application and team’s skills.
3. Is Apache JMeter free?
Yes. Apache JMeter is free and open-source software. Teams can use it to test websites, APIs, databases, and other supported services.
4. What is the difference between performance testing and load testing?
Performance testing covers several checks of speed and stability. Load testing focuses on how an application behaves under a planned amount of traffic.
5. Can k6 test APIs?
Yes. Grafana k6 supports HTTP and API testing. Developers can write test scenarios with JavaScript.
6. Which tool is best for Python developers?
Locust is a strong option for Python developers. It lets them write user behavior scenarios using Python code.
7. Can performance testing tools work with CI/CD pipelines?
Yes. Tools such as k6, JMeter, Gatling, and Artillery can work in automated development workflows.
8. What are the main performance testing metrics?
Important metrics include response time, throughput, error rate, CPU use, memory use, and network activity.
9. Can I use Sitespeed.io for load testing?
Sitespeed.io mainly measures browser-based website performance. It does not replace a dedicated load generator such as JMeter or k6.
10. How often should I perform performance testing?
Test before major releases and important campaigns. Also run regular tests when application traffic, code, or infrastructure changes.
Final Thoughts
Performance testing helps teams build faster and more stable applications. It shows how software behaves under different workloads.
Apache JMeter offers broad protocol support. Grafana k6 fits developer-led testing. Gatling supports code-based performance work, while Locust gives Python teams flexible control.
OpenText LoadRunner and Tricentis NeoLoad serve enterprise needs. BlazeMeter offers managed testing options. Artillery supports modern API and browser workflows. Sitespeed.io helps measure website speed, while WebLOAD supports complex business testing.
Before choosing, consider your application, team skills, budget, and infrastructure. Start with clear goals and realistic test scenarios. Then use the results to improve speed, stability, and user experience.