Introduction
Diagrams help people understand ideas faster. They turn complex information into clear visual steps. Teams use them to plan projects, explain systems, map business processes, and share technical details.
The right diagramming tool can make this work easier. It can help you build flowcharts, mind maps, network diagrams, charts, and process maps. Some tools focus on teamwork. Others offer advanced technical shapes or code-based diagrams.
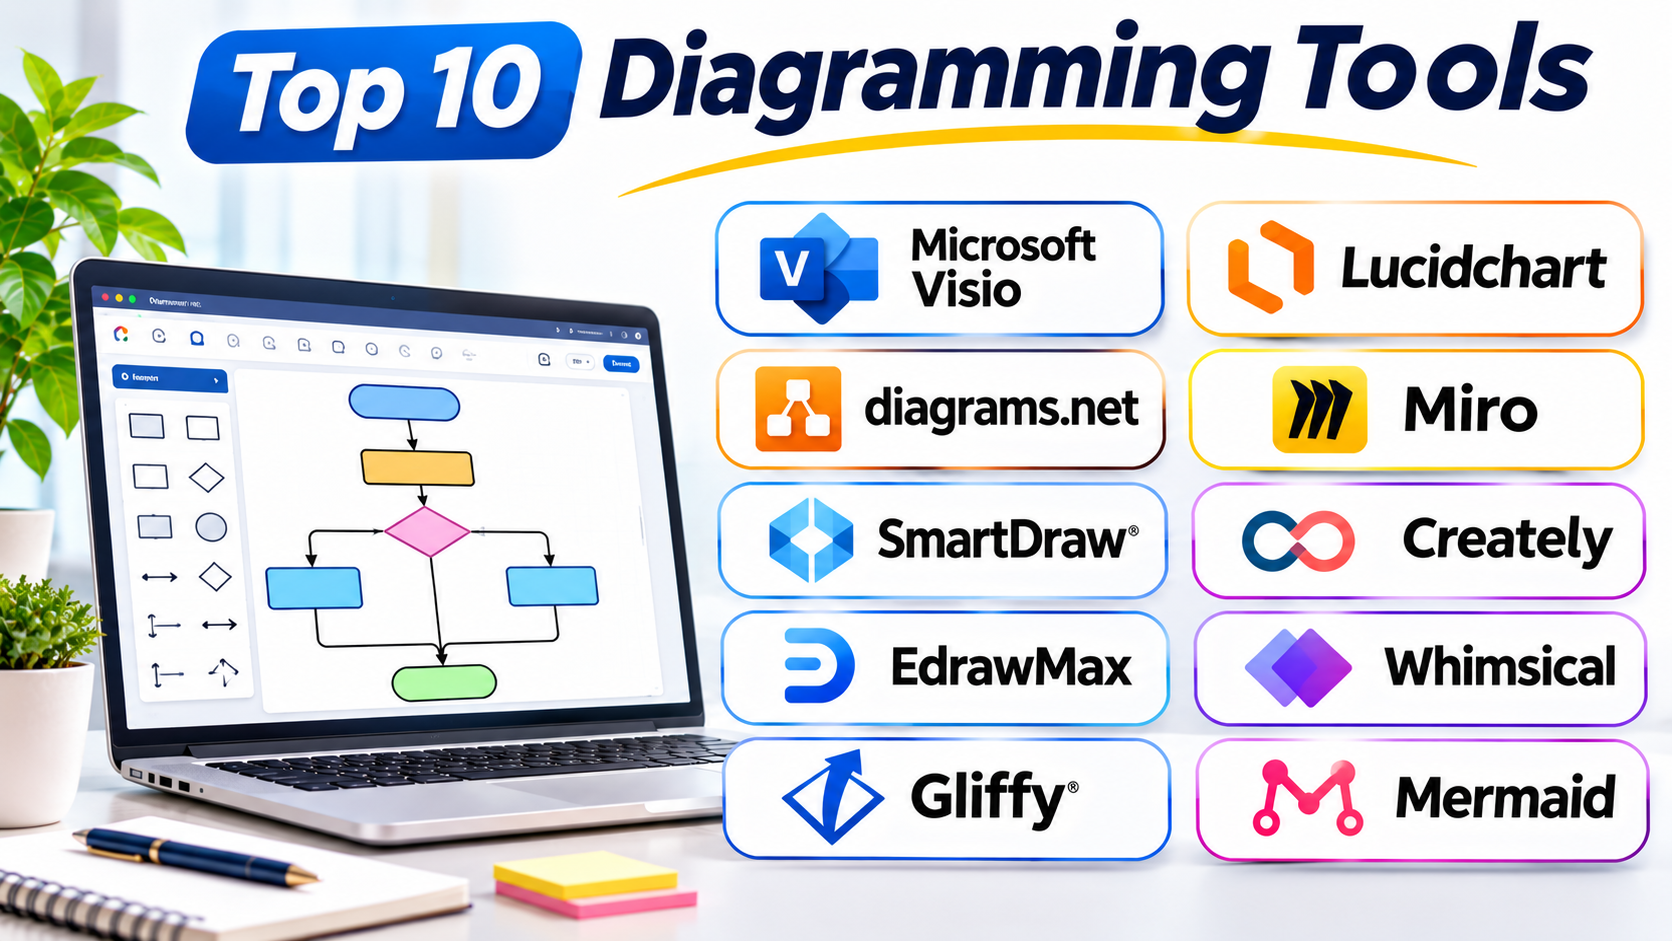
This guide reviews ten popular diagramming tools. It explains their main features, best uses, Pros, and Cons. It also includes a comparison table to help you choose.
What Is Diagramming Software?
Diagramming software helps users create visual plans and explain how things work. It uses shapes, lines, arrows, labels, and images.
People use these tools for many tasks, such as:
- Creating business process flowcharts.
- Mapping company teams and roles.
- Planning software and network systems.
- Showing project steps and decisions.
- Building mind maps and idea maps.
- Designing database and workflow diagrams.
- Creating technical plans and system layouts.
- Sharing ideas with teams and clients.
Some tools use ready-made templates. Others offer blank workspaces or code-based editing. Many also support online sharing and team feedback.
Top 10 Diagramming Tools
The tools below serve different needs. This list is not a strict performance ranking. The best choice depends on your work, team size, and diagram type.
1. Microsoft Visio
Microsoft Visio is a diagramming tool for business and technical work. It helps users create flowcharts, organization charts, network diagrams, floor plans, and process maps.
Visio offers a wide range of shapes and templates. Users can place shapes on a page and connect them with lines. The connectors help show how steps, teams, or system parts relate to each other.
The tool also supports detailed diagrams. Users can adjust shapes, add labels, group objects, and set page layouts. Some plans support data-linked diagrams. These can connect visual information with outside data sources.
Visio works well with other Microsoft products. Teams can store and share files through supported Microsoft services. They can also work with Visio files in the wider Microsoft environment.
Its desktop and web features depend on the plan. Users should check which version includes the tools they need. Some advanced features require a higher plan or desktop application.
Visio suits companies that need formal diagrams and Microsoft 365 workflows. It can help IT teams, business analysts, engineers, and project managers.
Pros
- Offers many business and technical diagram templates.
- Supports detailed flowcharts and network diagrams.
- Provides a wide range of shapes and connectors.
- Works with other Microsoft products.
- Supports data-linked diagrams in suitable plans.
- Handles complex diagrams for professional use.
Cons
- Some advanced features need higher plans.
- New users may need time to learn the interface.
- The full desktop experience may cost more.
- It may feel complex for simple diagrams.
- Teams should check file access and sharing needs.
2. Lucidchart
Lucidchart is an online diagramming tool for business and technical teams. It helps users create flowcharts, process maps, organization charts, network diagrams, and system designs.
Its editor uses a simple drag-and-drop approach. Users can add shapes, connect them, and move items around the page. This makes it easier to build diagrams without drawing every object by hand.
Lucidchart offers templates and shape libraries for many types of work. Users can also add text, images, links, and other details. These tools help teams create diagrams that explain both simple and complex ideas.
Collaboration is one of its main strengths. Several people can work on a diagram and share feedback. Teams can use comments and shared documents to review changes. Lucidchart also connects with selected business and project tools.
It can support technical diagrams, such as cloud architecture and network layouts. Users should check the available shape libraries and plan limits before starting a large project.
Lucidchart suits teams that need clear diagrams and shared editing. It can work well for business planning, software design, and process documentation.
Pros
- Easy drag-and-drop diagram editor.
- Offers templates for many diagram types.
- Supports real-time team collaboration.
- Useful for flowcharts and technical diagrams.
- Connects with selected business tools.
- Helps teams share and review diagrams.
Cons
- Some features require a paid plan.
- Free access has limits.
- Large diagrams may need careful layout work.
- Advanced shape libraries may depend on the plan.
- Users need an internet connection for its online workflow.
3. diagrams.net (draw.io)
diagrams.net, also known as draw.io, is a diagramming tool for users who want flexible diagram creation. It supports flowcharts, network diagrams, software designs, organization charts, and many other visuals.
The tool offers a simple editor with shapes, lines, arrows, and text boxes. Users can build diagrams from a blank page or choose a template. They can also use shape libraries for technical and business diagrams.
One major benefit is its flexible file storage. Users can work with supported local files and cloud storage options. This gives teams more control over where they keep their diagrams.
diagrams.net supports common export formats. Users can save diagrams for sharing, printing, or use in other documents. It also offers integrations with selected work and development tools.
The tool is useful for students, developers, IT teams, and small businesses. It can create many diagrams without the cost of a typical paid subscription.
However, its interface may feel less polished than some commercial tools. Teams that need advanced administration or managed collaboration should review their needs first.
Pros
- Free core diagramming features.
- Supports many types of diagrams.
- Offers a wide range of shapes and templates.
- Supports local and cloud storage options.
- Exports diagrams in common formats.
- Useful for technical and business users.
Cons
- The interface may feel less modern.
- Some team features depend on integrations.
- Large diagrams need manual organization.
- Users must manage their own file storage.
- Advanced business controls may be limited.
4. Miro
Miro is an online visual workspace for teamwork. It combines diagramming with brainstorming, planning, and project discussions.
Its large canvas gives teams room to place ideas and connect them. Users can add shapes, sticky notes, text, images, and diagrams. They can also use templates to start workshops, process maps, mind maps, and planning sessions.
Miro works well when a team needs to discuss ideas and build a visual plan together. People can add content, move objects, and share feedback on the same board. This makes it useful for remote meetings and group planning.
The platform also offers tools for flowcharts and technical diagrams. Teams can use connectors and shape libraries to show steps or system links. Some advanced features depend on the plan.
Miro is not only a traditional diagram editor. It is a wider workspace for visual teamwork. This gives users more freedom, but it may feel less structured for formal technical documents.
Miro suits product teams, project managers, teachers, and remote teams. It is especially useful when people need to brainstorm before creating a final diagram.
Pros
- Large canvas for visual planning.
- Useful templates for workshops and diagrams.
- Supports team collaboration.
- Combines brainstorming and diagramming.
- Offers tools for mind maps and flowcharts.
- Works well for remote teams.
Cons
- The open canvas can become cluttered.
- Some features require paid plans.
- Formal technical diagrams may need extra care.
- Large boards can be harder to manage.
- Users need clear rules for shared workspaces.
5. SmartDraw
SmartDraw is a diagramming tool for business, technical, and planning tasks. It helps users create flowcharts, organization charts, network diagrams, floor plans, and mind maps.
Its templates help users start quickly. They can choose a diagram type and add the details. SmartDraw also offers automatic layout tools. These help arrange shapes and keep diagrams neat as users make changes.
The software supports many business and technical uses. Teams can create process maps, project charts, office layouts, and network plans. It also offers symbols and templates for different industries.
SmartDraw can help users who do not have design experience. Its layout tools reduce some of the work involved in placing and connecting objects. This can save time when users create common diagrams.
The platform also supports file sharing and selected integrations. Users should check the current plan for export, storage, and collaboration features.
SmartDraw suits business teams that create diagrams often. It can also help people who need templates and automatic formatting instead of full manual design control.
Pros
- Large library of diagram templates.
- Automatic layout helps keep diagrams organized.
- Supports business and technical diagrams.
- Useful for organization charts and floor plans.
- Helps beginners create neat diagrams.
- Offers sharing and integration options.
Cons
- Some features require a paid plan.
- Automatic layouts may limit custom design.
- Users may need time to find the right template.
- It may offer more features than casual users need.
- Teams should review export options before choosing a plan.
6. Creately
Creately is a visual workspace for diagramming, planning, and team collaboration. It helps users create flowcharts, mind maps, organization charts, process maps, and technical diagrams.
The editor combines shapes, connectors, text, and templates. Users can build diagrams from scratch or use a ready-made layout. They can also link ideas and information to create a more connected visual workspace.
Creately supports team work through shared spaces and collaboration tools. This can help teams plan projects, map processes, and document company knowledge.
The platform also offers features for visual planning and data-linked work. These tools can help users connect diagrams with information. The exact options depend on the selected plan.
Creately can suit teams that need more than a basic diagram editor. It brings planning and visual documentation into one workspace. However, users should test the editor with their own diagrams before moving all their work.
It works well for business teams, project managers, educators, and people who need shared visual planning.
Pros
- Supports many diagram types.
- Combines diagramming and visual planning.
- Offers templates for business tasks.
- Supports shared team workspaces.
- Helps users map processes and ideas.
- Includes options for connected visual information.
Cons
- Some features depend on the selected plan.
- New users may need time to learn its wider workspace.
- Export options can vary by plan.
- Complex diagrams need careful organization.
- Users should test integrations before relying on them.
7. EdrawMax
EdrawMax is a diagramming tool that supports many business, technical, and educational diagrams. It helps users create flowcharts, network diagrams, mind maps, floor plans, organization charts, and engineering visuals.
The software offers a large collection of templates and symbols. Users can select a diagram type and add shapes from the library. They can also change colors, text, lines, and page layouts.
EdrawMax supports both simple and detailed diagrams. This makes it useful for people who work across different fields. For example, a business user can create a workflow, while an IT user can design a network layout.
The platform offers desktop and online options. It also supports file import and export. Users should check the current version and plan to confirm the formats and features they need.
EdrawMax suits users who want many diagram types in one product. It can help schools, businesses, engineers, and independent designers.
However, its wide range of tools may feel crowded at first. Users may need time to learn where each feature sits.
Pros
- Supports a wide range of diagram types.
- Offers many templates and symbols.
- Useful for business and technical work.
- Provides desktop and online options.
- Supports file import and export.
- Helps users create detailed diagrams.
Cons
- The interface may feel busy to new users.
- Some features require a paid license.
- Large template libraries can take time to explore.
- Users should check export support for their workflow.
- Advanced diagrams may need careful manual editing.
8. Whimsical
Whimsical is a visual workspace for flowcharts, wireframes, mind maps, and simple planning diagrams. It focuses on speed and a clean editing experience.
Users can create diagrams with shapes, lines, text, and connectors. They can also use templates to start common tasks. The simple layout helps people focus on ideas instead of complex design settings.
Whimsical works well for product teams and people who plan user journeys. They can map how users move through an app or website. They can also create process flows and mind maps to explain ideas.
The platform supports collaboration. Team members can share boards and add feedback. This makes it useful during product planning and early design work.
Whimsical focuses on simple, clear visuals. It may not offer the depth needed for complex engineering diagrams or detailed network plans. Users should match the tool to the type of diagram they create.
It suits product managers, designers, developers, and teams that need quick visual planning.
Pros
- Clean and simple interface.
- Fast flowchart creation.
- Useful for mind maps and user flows.
- Offers templates for common tasks.
- Supports team sharing and feedback.
- Helps teams plan ideas quickly.
Cons
- Advanced technical diagram tools may be limited.
- Some features require a paid plan.
- Complex layouts may need another tool.
- Users have less control over some design details.
- It may not suit formal engineering documentation.
9. Gliffy
Gliffy is an online diagramming tool used for flowcharts, network diagrams, organization charts, and technical visuals. It is known for its connection with Atlassian products.
Users can create diagrams with shapes, lines, text, and templates. The editor supports common diagram tasks without requiring advanced design skills. Users can also share diagrams with teammates.
Gliffy can be useful for teams that work with Confluence and Jira. They can add diagrams to project pages and technical documents. This helps keep visual information close to related project content.
The tool supports business and technical diagrams. Teams can use it to explain workflows, system layouts, and project plans. Its browser-based workflow can also help users work from different locations.
Gliffy may be a good fit for organizations that already use Atlassian tools. Teams that need a wide range of standalone diagram features should compare it with other products before choosing.
Pros
- Easy online diagram editor.
- Supports flowcharts and technical diagrams.
- Useful connection with Atlassian products.
- Helps teams add diagrams to project documents.
- Offers shapes and templates.
- Suitable for shared business workflows.
Cons
- Some features depend on the selected plan.
- Best value may come from Atlassian workflows.
- Advanced design options may be limited.
- Users should check export and file support.
- It may not suit every standalone diagramming need.
10. Mermaid
Mermaid is a text-based diagramming tool. It lets users create diagrams by writing simple code-like text.
Instead of dragging shapes onto a page, users type instructions that describe the diagram. Mermaid then turns that text into a visual result. It supports flowcharts, sequence diagrams, class diagrams, state diagrams, and other technical visuals.
This approach works well for developers and technical writers. They can keep diagrams close to their code or documentation. They can also track diagram changes with version control systems.
Mermaid is useful for software documentation. For example, a developer can show how an application sends data between services. A technical writer can explain a process through a sequence diagram.
The tool is different from visual editors such as Visio or Lucidchart. Users need to learn its syntax. A small text change can update a diagram, but complex layouts may need careful editing.
Mermaid suits developers, engineers, and teams that manage technical documents. It may not be the best option for users who prefer drag-and-drop design.
Pros
- Creates diagrams from text.
- Useful for technical documentation.
- Supports several diagram types.
- Works well with version control.
- Helps keep diagrams close to written content.
- Can speed up repeatable diagram updates.
Cons
- Users must learn its syntax.
- It offers less visual drag-and-drop editing.
- Complex layouts may need extra effort.
- Not every diagram style fits its supported types.
- Non-technical users may prefer a visual editor.
Diagramming Tools Comparison Table
| Tool | Best For | Main Strength | Collaboration | Main Consideration |
|---|---|---|---|---|
| Microsoft Visio | Business and technical diagrams | Detailed shapes and templates | Supported sharing and co-authoring | Some features need higher plans |
| Lucidchart | Team diagramming | Easy editor and templates | Real-time collaboration | Free plan has limits |
| diagrams.net | Free diagram creation | Flexible storage and export | Integration-based options | Users manage their own files |
| Miro | Brainstorming and planning | Large shared canvas | Strong team workspace | Boards can become cluttered |
| SmartDraw | Business diagrams | Templates and automatic layouts | Sharing and integrations | Custom layouts may need extra work |
| Creately | Visual planning | Diagrams and shared workspaces | Team collaboration | Features vary by plan |
| EdrawMax | Many diagram types | Large template and symbol library | Plan-dependent | Interface can feel busy |
| Whimsical | Simple flowcharts | Clean and fast editor | Shared boards and feedback | Limited for complex technical work |
| Gliffy | Atlassian teams | Confluence and Jira workflows | Shared diagram editing | Best fit depends on Atlassian use |
| Mermaid | Developer documentation | Text-based diagrams | Version-control workflows | Requires syntax knowledge |
How to Choose the Right Diagramming Tool
The best tool depends on what you need to show. A flowchart tool may not meet the needs of an IT team. A large visual workspace may not suit a formal network plan.
1. Identify Your Diagram Type
First, list the diagrams you create most often.
- Use flowchart tools for steps and decisions.
- Use mind maps for ideas and planning.
- Use network tools for IT systems.
- Use organization charts for company roles.
- Use sequence diagrams for software actions.
- Use process maps for business workflows.
Choose a tool that supports your main diagram types.
2. Check Ease of Use
A simple editor can save time. Look for clear menus, ready-made shapes, and useful templates.
If your team has little design experience, try a tool with drag-and-drop editing. Developers may prefer text-based tools such as Mermaid.
3. Review Team Features
Think about how people will use each diagram. Some teams work alone. Others need shared editing and comments.
Check whether the tool supports:
- Real-time editing.
- Comments and feedback.
- Shared workspaces.
- Access controls.
- Version history.
- Easy links for reviewers.
4. Check File Formats
You may need to share diagrams with clients or use them in reports. Check whether the tool exports formats such as PNG, SVG, PDF, or other files you need.
Also test whether it can open files from your current diagramming tool. A file may open but still lose some shapes or layout details.
5. Review Privacy and Storage
Some tools store diagrams online. Others support local files or different storage options.
Check where the tool stores your data. Review who can access shared diagrams. This matters when diagrams include company plans, network details, or private project information.
6. Compare the Full Cost
Do not compare only the starting price. Check the number of users, file limits, export options, storage, and team features.
A free plan may work for small tasks. A paid plan may be better when a team creates diagrams every day.
7. Test a Real Diagram
Try the same task in two or three tools. Use a real workflow, network map, or project chart.
Check how quickly you can build it. Review how easy it is to edit, share, and export. This test can help you make a better choice.
Common Diagramming Mistakes to Avoid
Good software helps, but clear diagrams still need good planning.
- Adding too much detail: Keep each diagram focused on one main idea.
- Using unclear labels: Choose short words that people can understand.
- Mixing too many colors: Use colors with a clear purpose.
- Creating messy lines: Keep connectors neat and easy to follow.
- Ignoring the audience: Use simple diagrams for general readers.
- Skipping file checks: Review exported diagrams before sharing.
- Forgetting updates: Keep diagrams in sync with real processes.
- Sharing private data: Check access settings before sending a diagram.
Questions and Answers
1. What is diagramming software used for?
Diagramming software helps users turn ideas into visual plans. People use it for flowcharts, mind maps, network layouts, and business processes.
2. Which diagramming tool is best for beginners?
diagrams.net and Lucidchart are useful starting points. Both offer visual editing and ready-made shapes. Whimsical is another simple option for quick flowcharts.
3. Which diagramming tool is free?
diagrams.net offers free core diagramming features. Mermaid is also free and open source. Both can help users create diagrams without a standard paid subscription.
4. Which tool is best for business process diagrams?
Microsoft Visio, Lucidchart, and SmartDraw are strong options. They offer shapes and templates for business workflows. The best choice depends on your team and budget.
5. Which tool is best for technical diagrams?
Microsoft Visio, Lucidchart, and diagrams.net support many technical diagram types. Mermaid is useful for developers who prefer text-based diagrams.
6. Can diagramming tools support team collaboration?
Yes. Many tools support shared workspaces, comments, and team editing. Miro, Lucidchart, Creately, and Whimsical offer collaboration features.
7. What is the difference between diagramming software and mind mapping software?
Diagramming software supports many visual formats. These include flowcharts, network maps, and process diagrams. Mind mapping software focuses more on linking ideas around a central topic.
8. Can I export diagrams as images or PDFs?
Many diagramming tools support image or PDF exports. The available formats can depend on the tool and plan. Check export options before choosing a product.
9. Is Mermaid suitable for non-technical users?
Mermaid may feel difficult for people who prefer visual editing. Users create diagrams by writing text with a set syntax. It works best for people who feel comfortable with simple code-like instructions.
10. What should I check before choosing diagramming software?
Check diagram types, ease of use, collaboration, export formats, storage, privacy, and cost. Also test the software with a real project before making your choice.
Final Thoughts
The right diagramming tool helps people explain ideas with less effort. It can also make teamwork and planning much clearer.
Microsoft Visio suits detailed business and technical diagrams. Lucidchart supports shared diagram work. diagrams.net offers a flexible free option. Miro works well for group planning. SmartDraw helps users build common diagrams with templates. Creately and EdrawMax support many visual tasks. Whimsical keeps simple diagrams easy to create. Gliffy fits teams that use Atlassian products. Mermaid helps developers keep diagrams close to their documentation.
Before you decide, think about the diagrams you create most often. Test a few tools with real work. Then choose the one that fits your team, skills, and budget.
Research note: Product features and plan limits can change. Review the vendor’s current details before purchasing. The tool selection reflects current diagramming categories and use cases. iTechGuides+3